
3 Ways To Optimize Space Usage In Tableau Dashboard Using Hidden Containers
Hidden containers are one of the features in Tableau that optimizes space utilization on a dashboard and improves its interactiveness. There are several uses for this feature and this article will look at some ways you can spice up your dashboard with hidden containers.
Using hidden containers to add more information
In dashboard development, you may receive requests from users to include the underlying data you used to build your dashboard but this information might be too much detail to showcase in the dashboard. In this scenario, it is good to use hidden containers and creating a toggle button to switch between the detailed and chart views.
Here are the quick steps to achieve it!
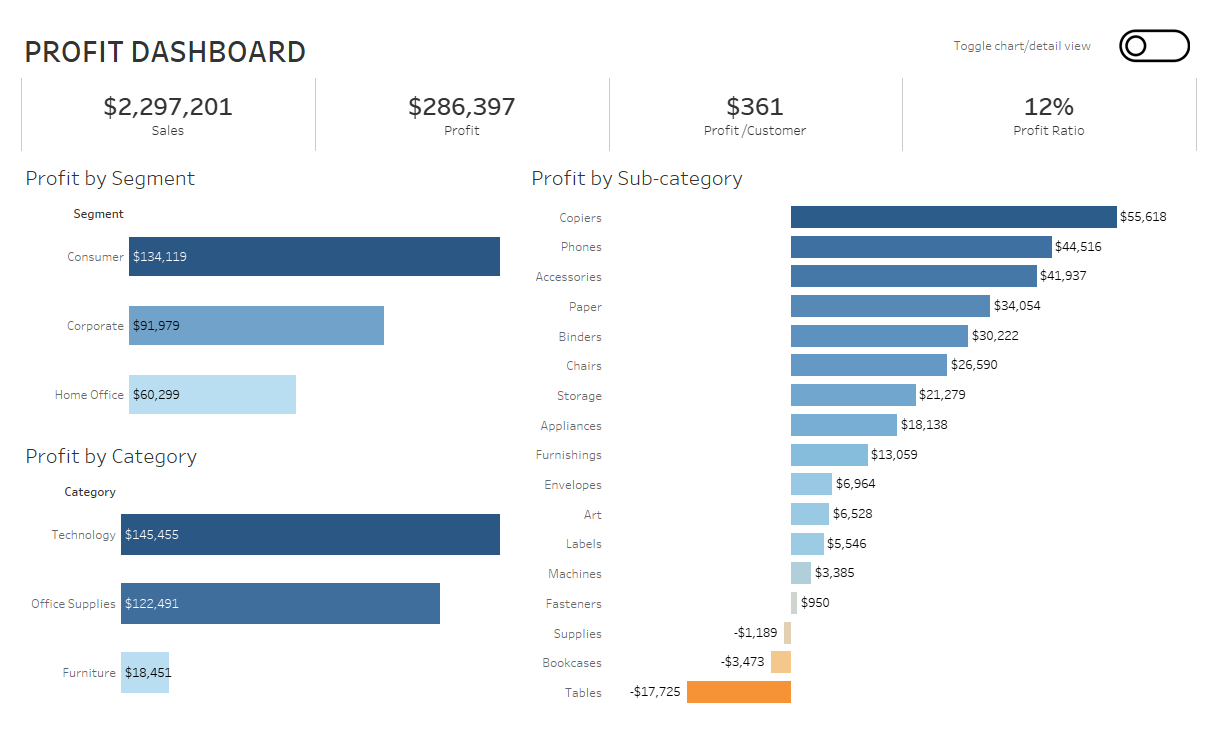
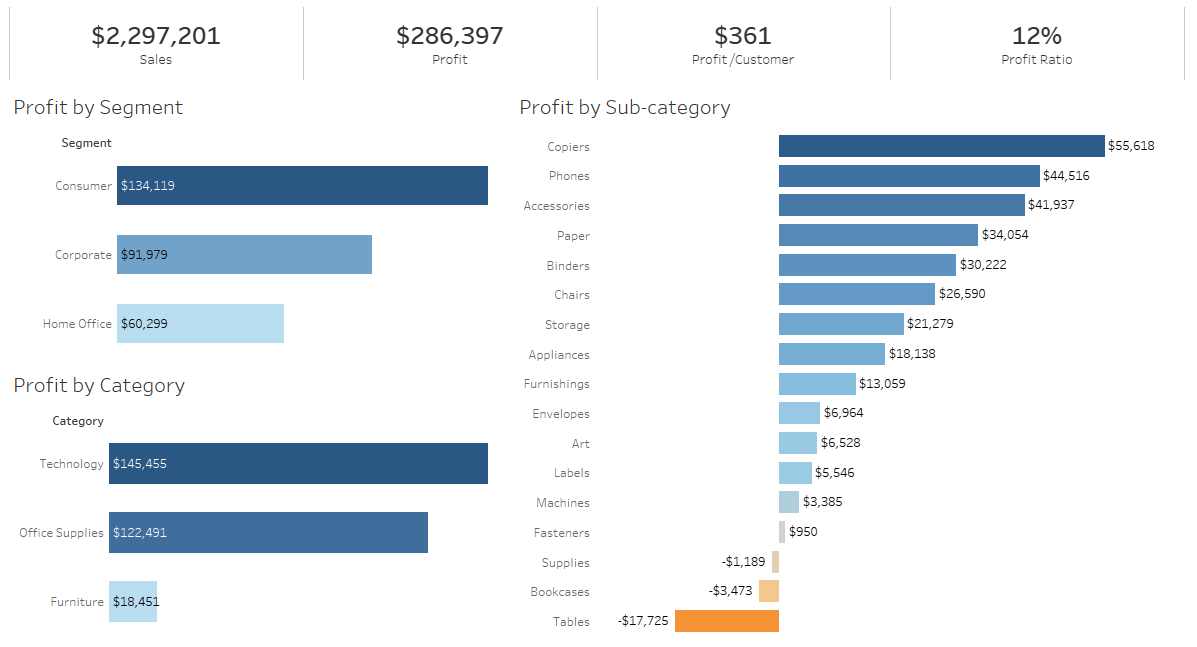
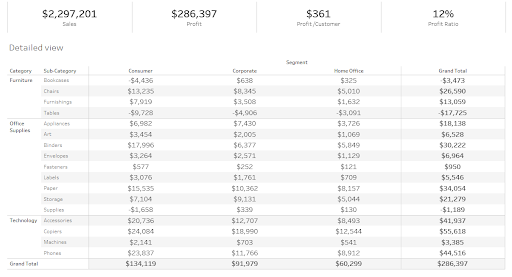
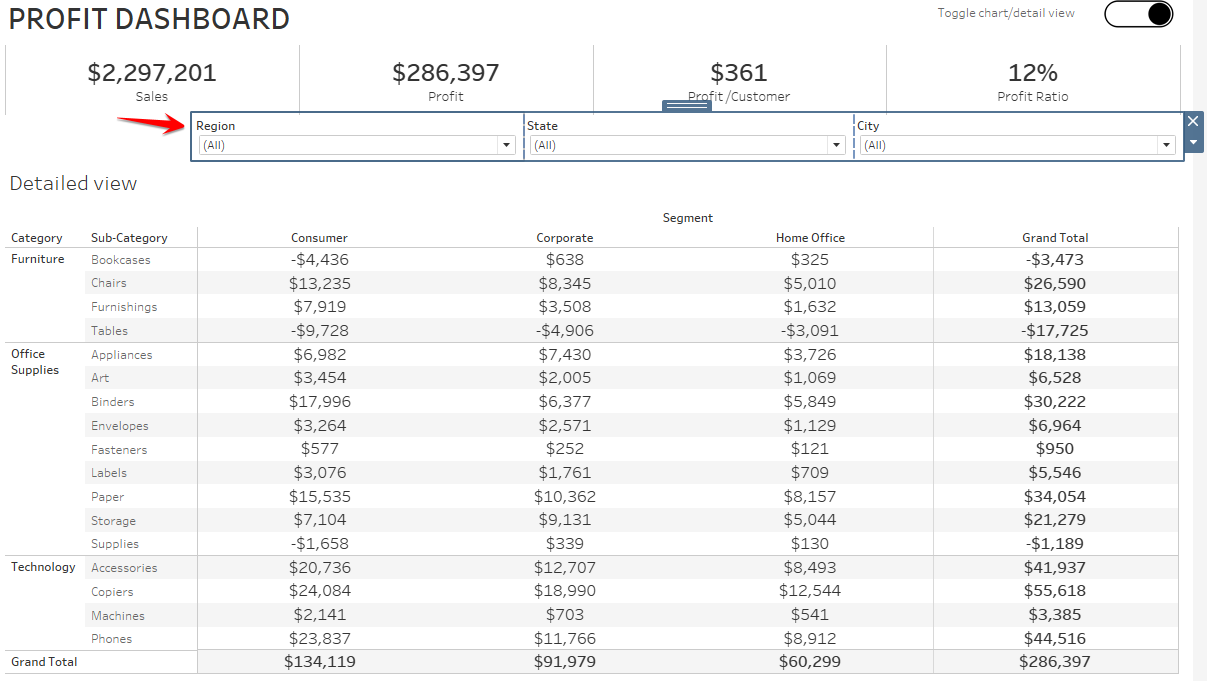
- Connect to your superstore data set and build a simple dashboard as shown in the screenshot below.
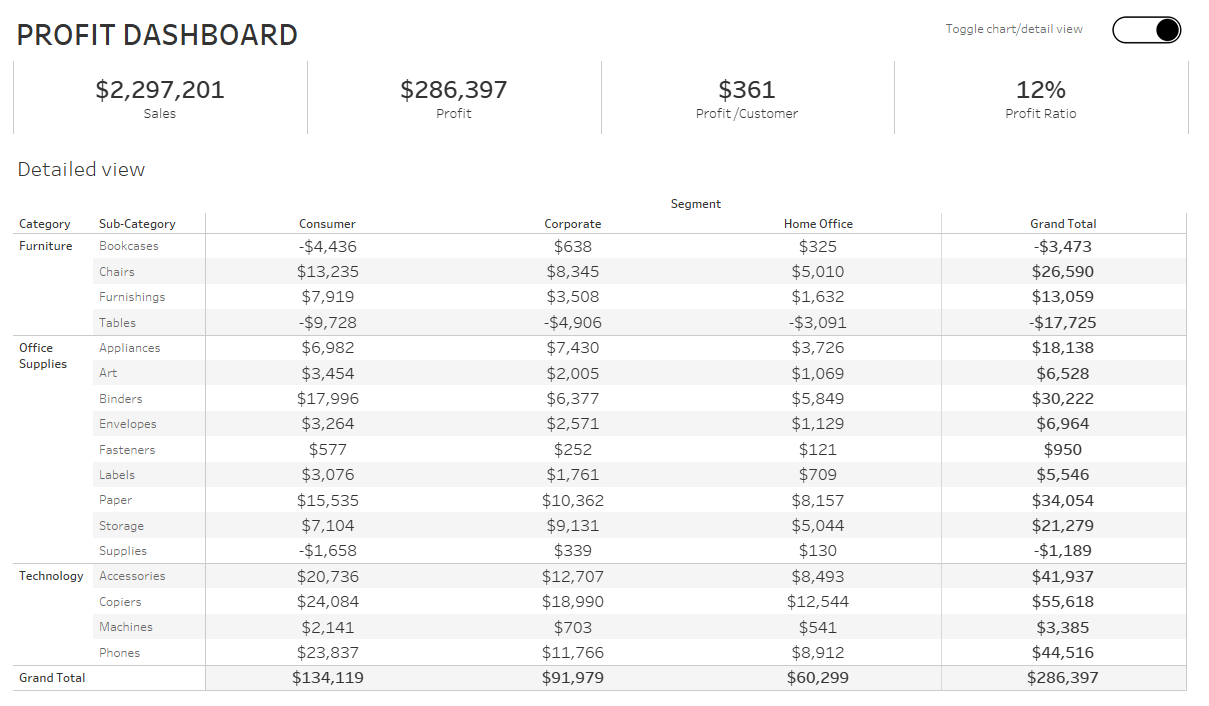
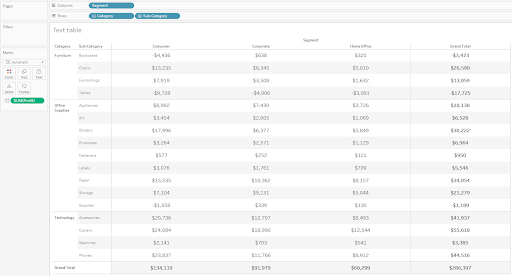
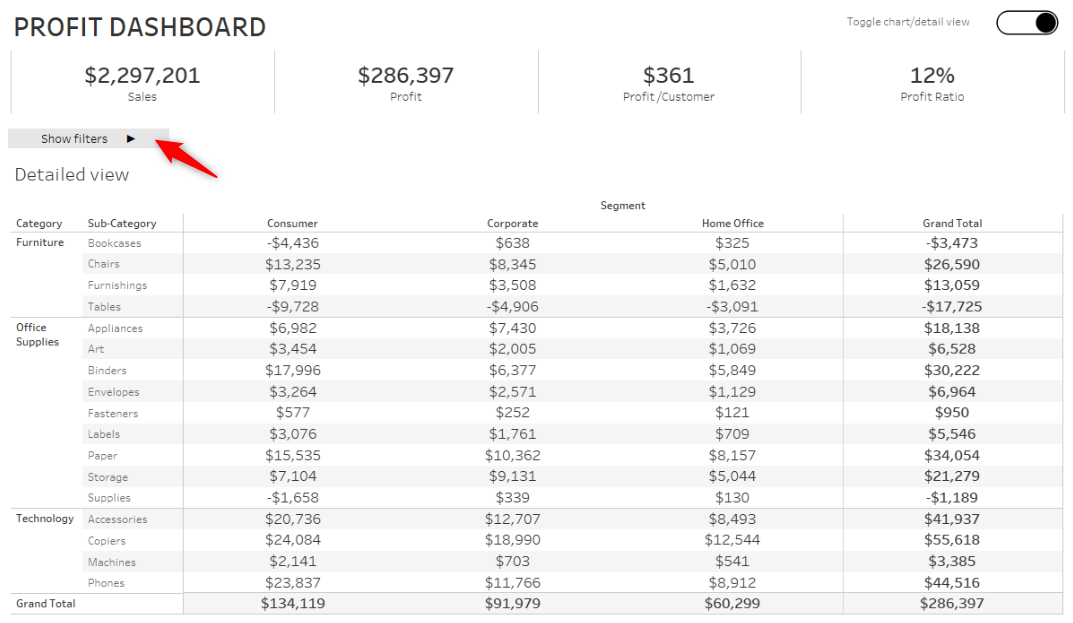
- Build a chart that shows the details of the charts on the dashboard as a text table, along with Row and Column totals.
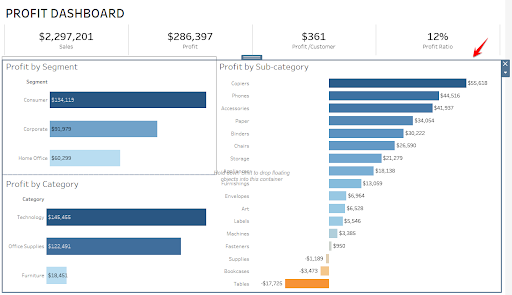
- Now go back to your dashboard, and drag a floating layout container (vertical or horizontal) into it, and float this over your charts as shown in the screenshot below.
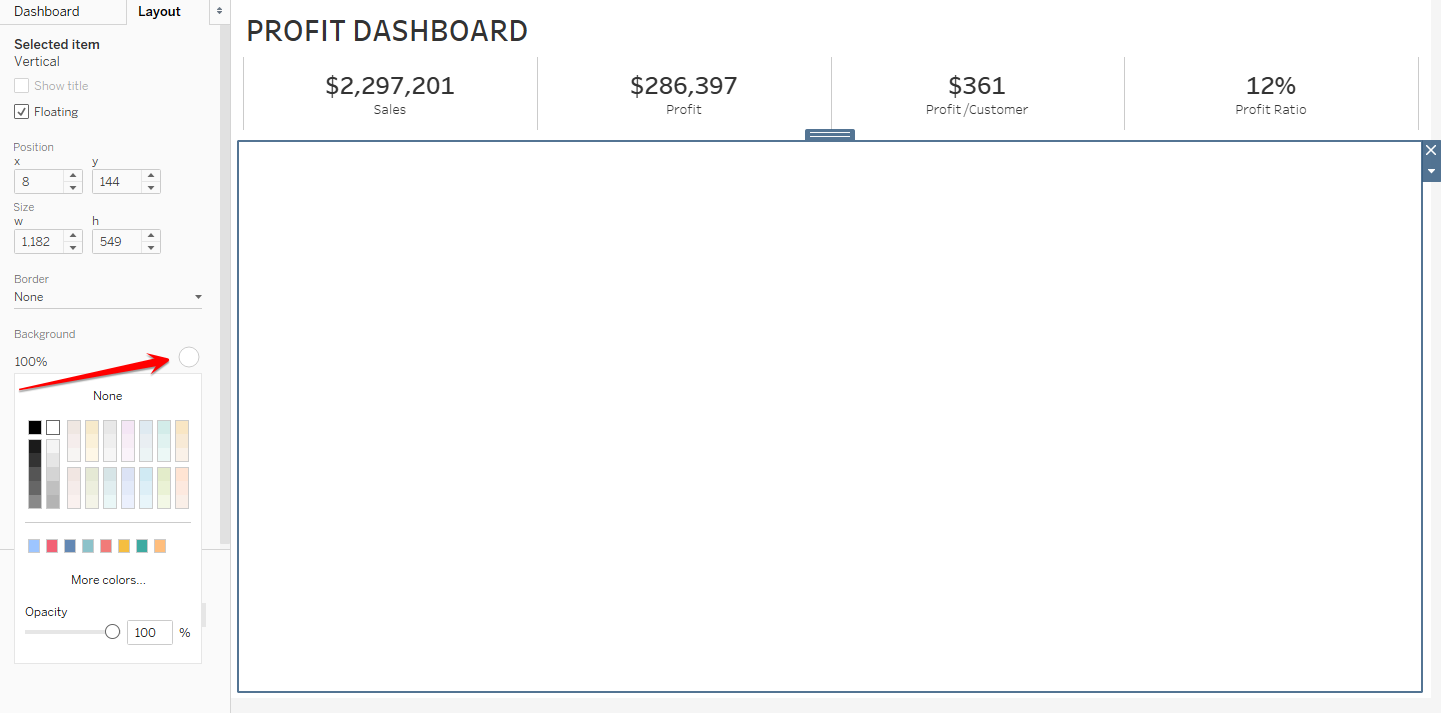
- In the layout menu, change the background color to white. This will ensure that once we toggle to the detail view, the underlying chart view is hidden behind the container.
- Now drag your text table with the detailed view of your data (created in step 2) to this layout container. You need to make sure the chart is within the layout container for it to work. The current view should now look like the screenshot below.
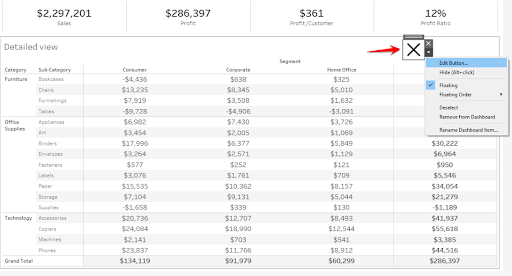
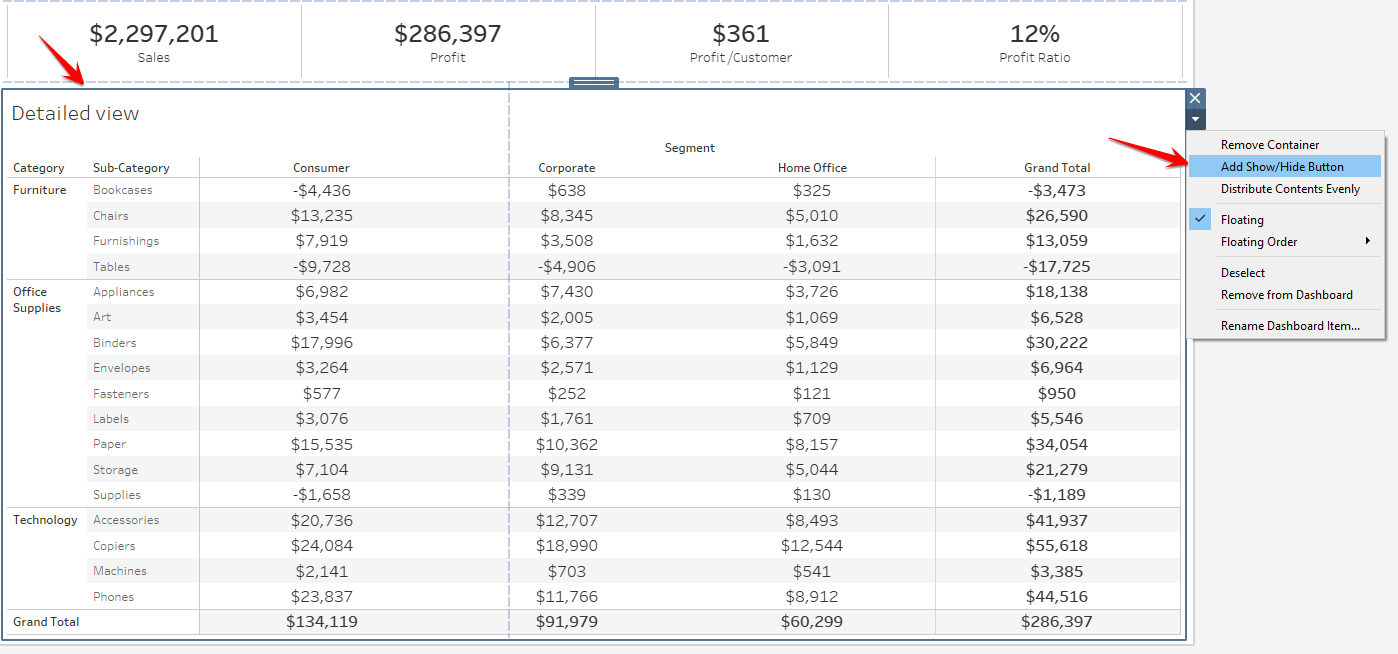
- Now click on the detailed view chart and select the layout container.
- Once the layout container is selected, you’ll notice a blue border around it. Select Add Show/Hide Button.
- You’ll notice an x-icon showing up on your dashboard. Select it and click Edit Button.
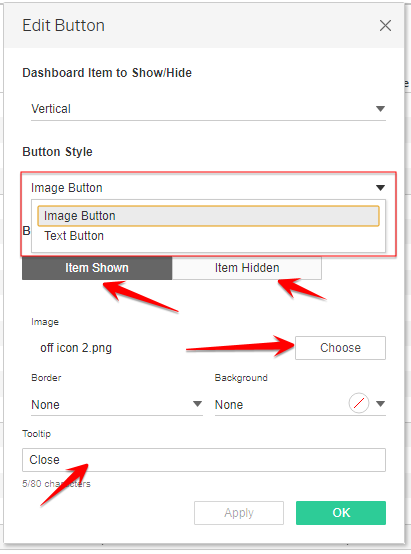
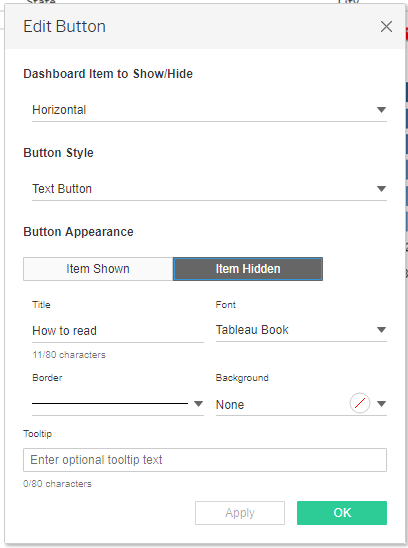
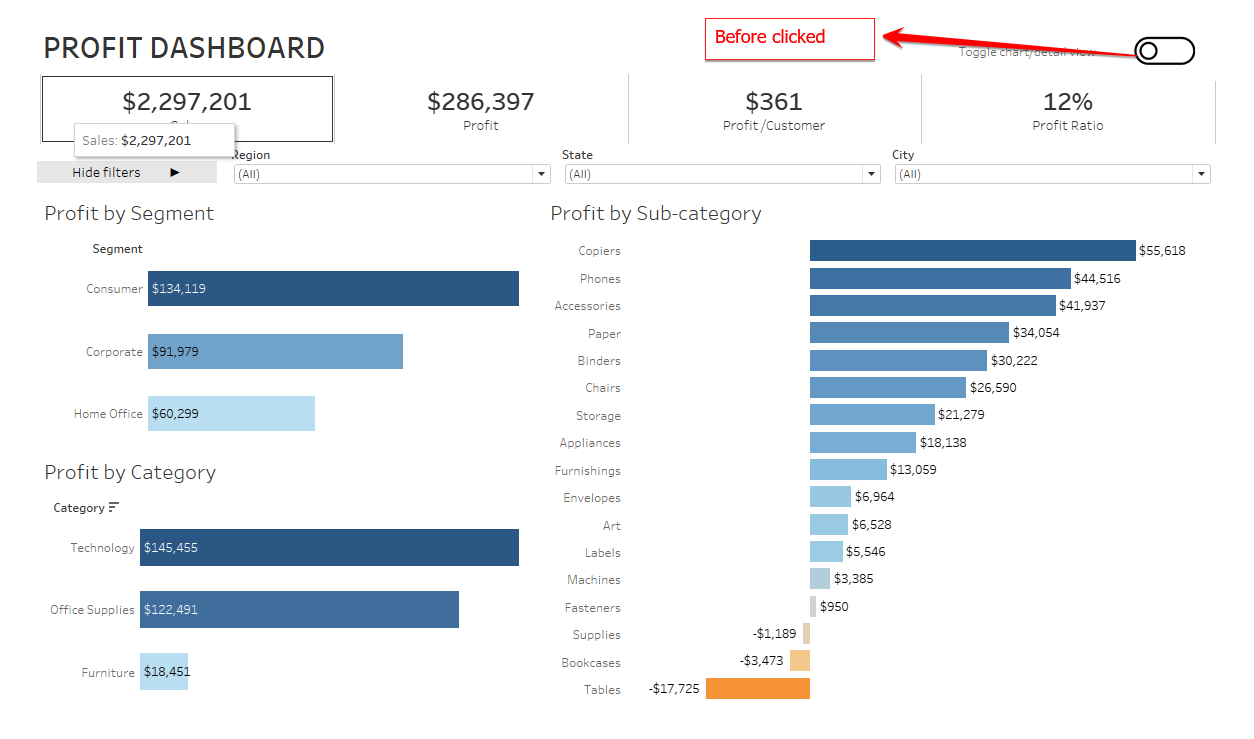
In the Edit menu, you can choose to select a button view or a text view. When you select a button view, you can use an image to show how to display an item hidden or closed in your container. Text view allows you to create your own text buttons and display whatever information you want in them. In this example, we will use a button view. - First, click on Item Shown then select an image for it. Do the same for Item hidden and select an image for it. You can use the tooltip to show a user what clicking the button will do. When working with an image view, we can place a text box next to the button to show what it does. In the screenshot below you see a button that shows us when the chart view is shown and another when the detailed view is shown.

Using hidden containers to show filters
Just as we used the hidden container to hide additional information on the dashboard, we can also place filters or parameters into a hidden container to equip the user display or hide them as needed.
Now let’s take a look at the steps.
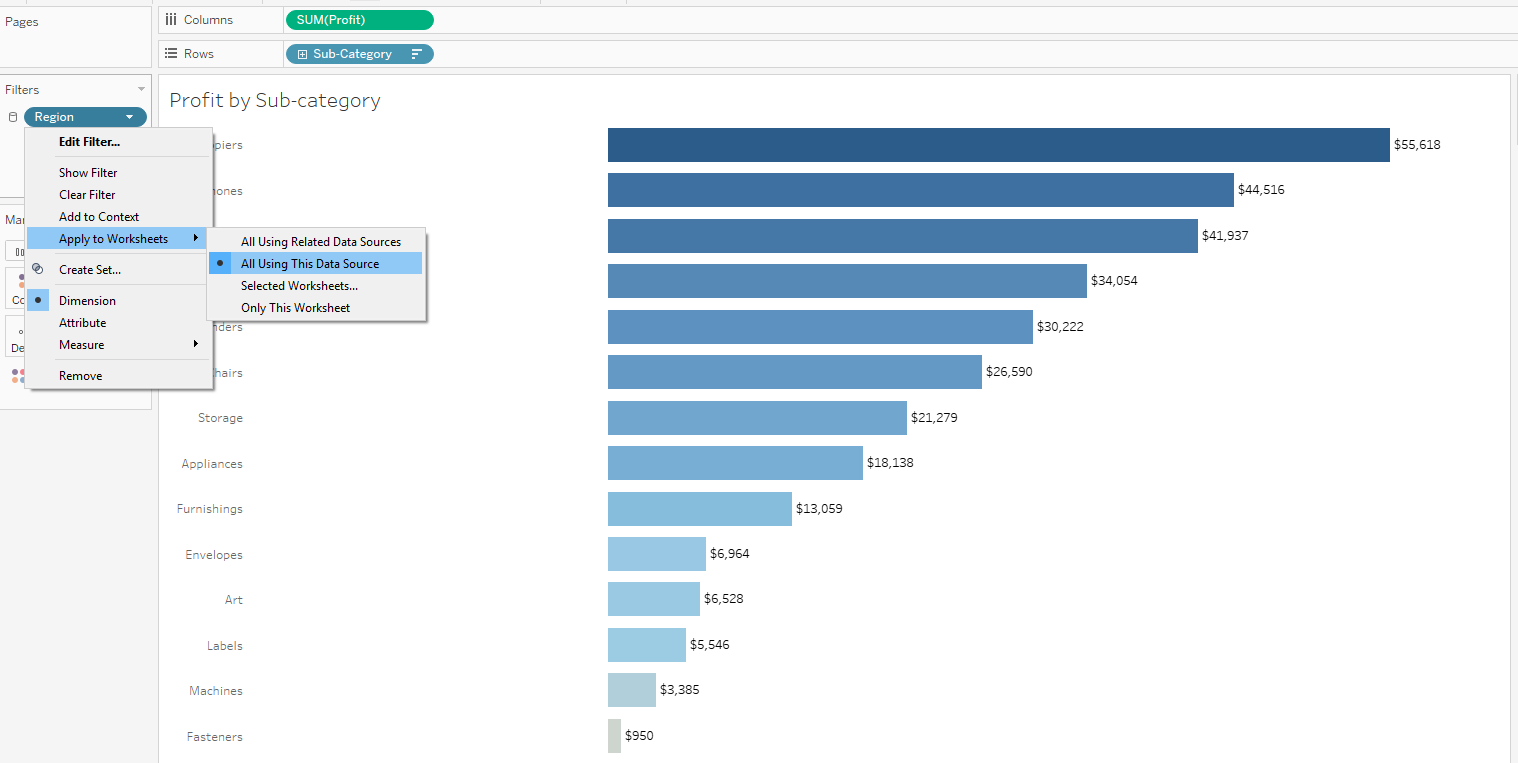
- Select any chart and bring Region, State, and City to the filter shelf. Make the filters global by applying them to all charts using the data source.
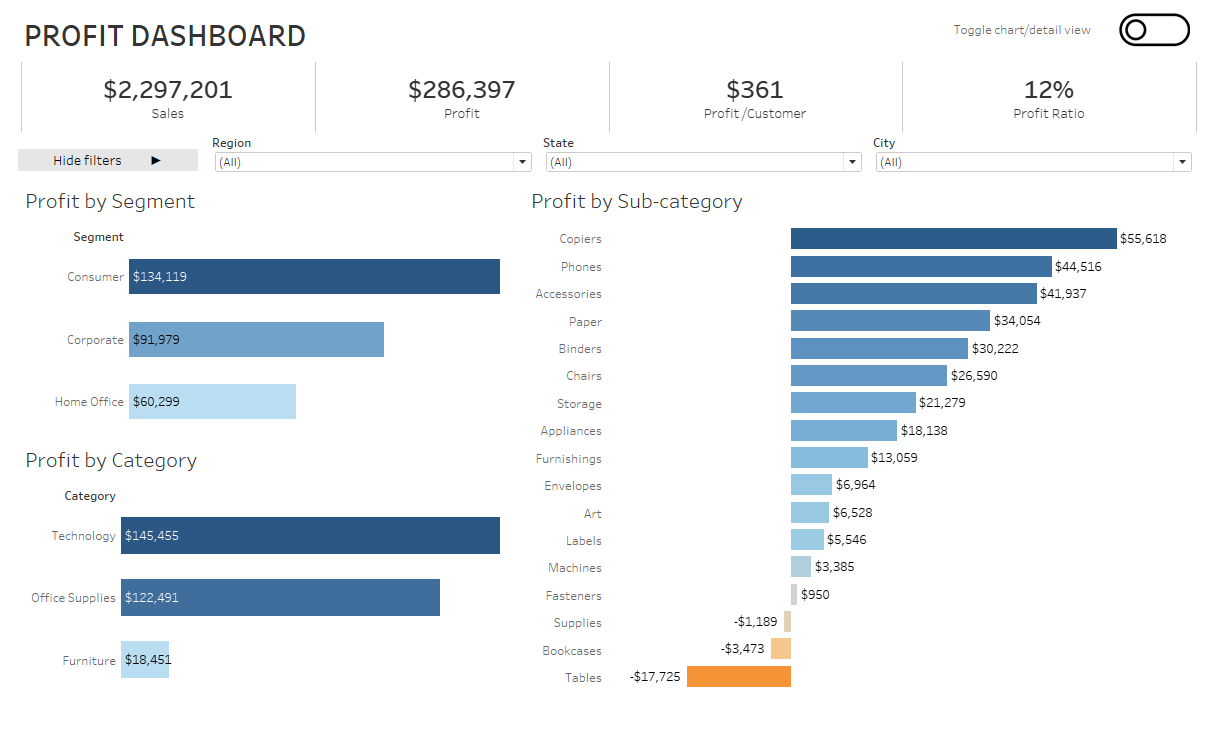
- On your dashboard, show all your 3 filters as floating filters on the dashboard.
- Bring in a horizontal floating container to the dashboard and place the filters into it as shown below.
- Select the layout container then choose Add Show/Hide Button.
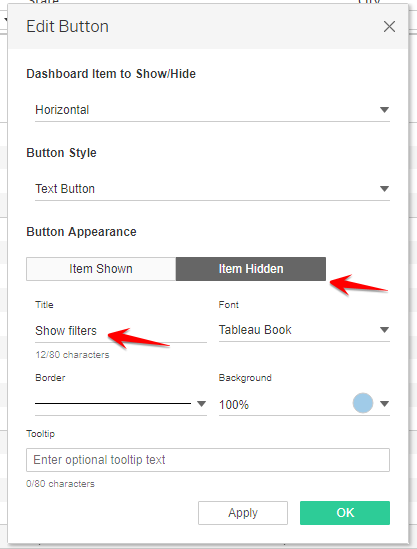
- Now edit the default button that shows by selecting Edit Button.
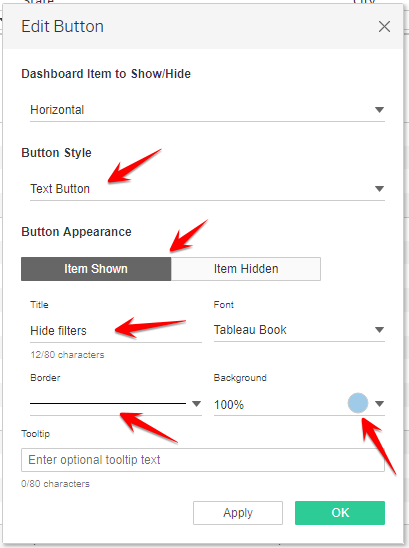
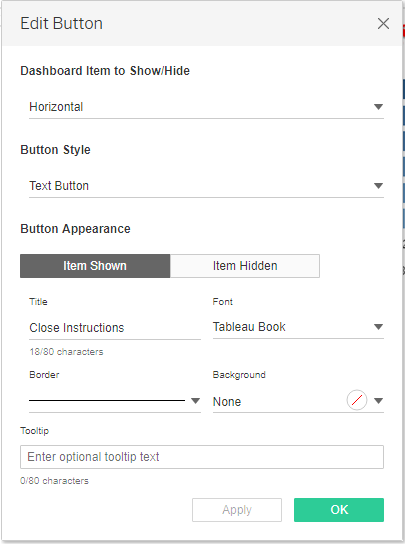
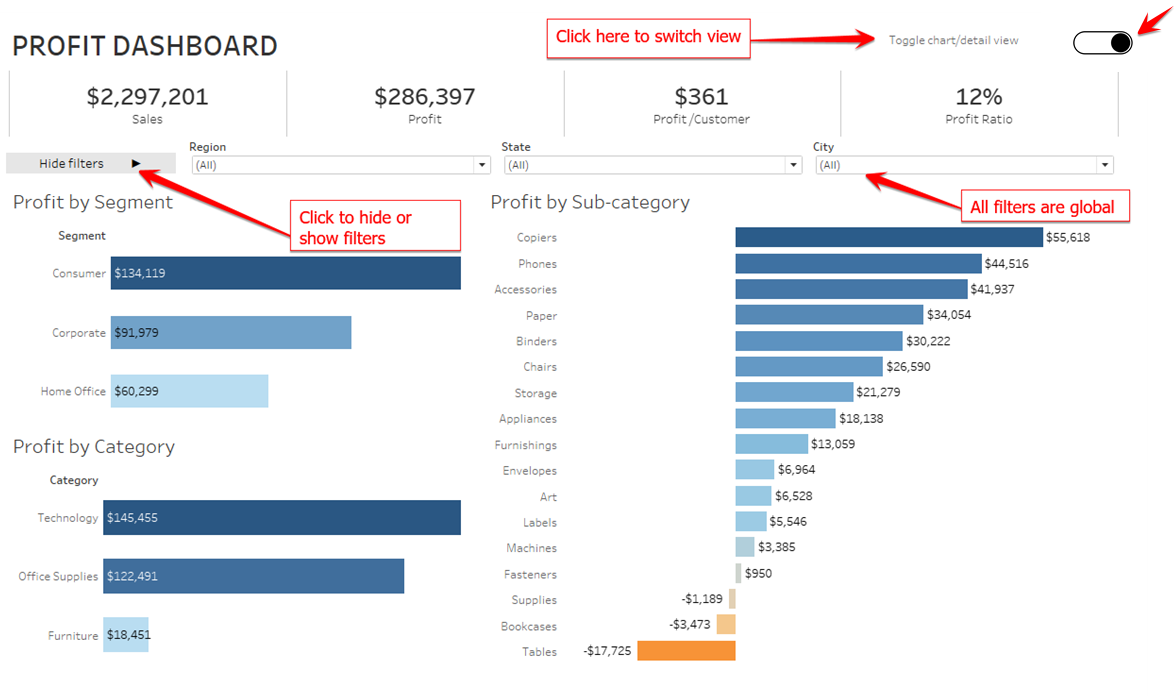
- Let’s select the text button style this time. Enter the title as “Hide filters” when Item Shown is selected, and “Show filters” when Item Hidden is selected, as shown in the screenshots below.
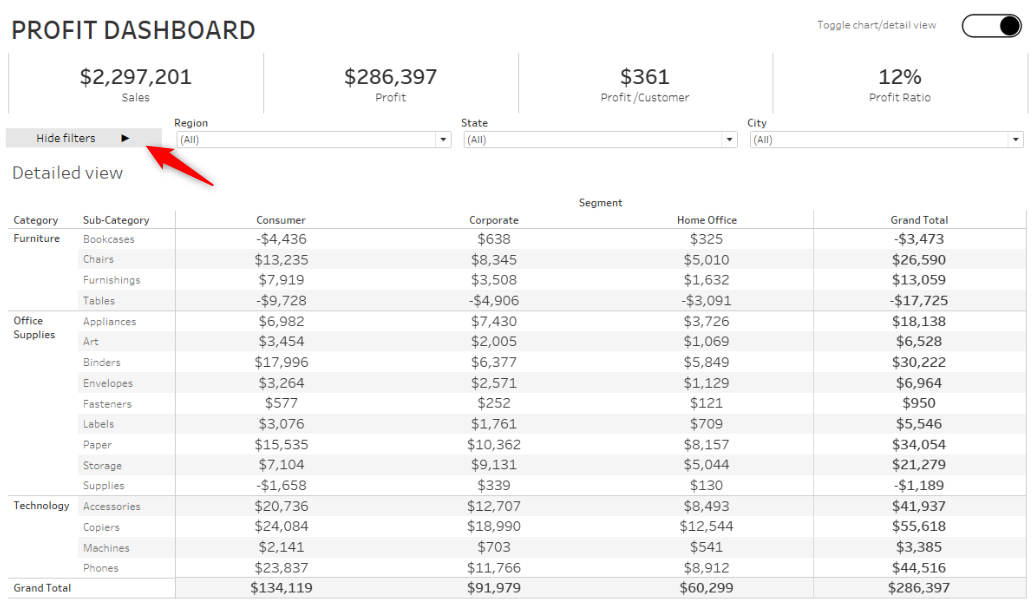
- We can play around with the formatting options of the button to make it to match the overall dashboard design. After finalizing the format options, click Ok. Your button should now look similar to the ones in the screenshots below.
Using hidden containers to show instructions for your dashboard
Another important use for hidden containers is to use it as a means to show a user how to interact with your dashboard. There may be situations where your dashboard has a lot of interactive features that the users might find it difficult to understand. In such scenarios, you may need to do a demo to help them understand how to use your dashboard. Hidden containers help to save time in doing presentations or writing detailed instructions.
Now let’s learn the steps to achieve this.
- After you have completed your dashboard, export the image of it using the export image option from the dashboard menu or simply take a screenshot.
- Bring your image into PowerPoint or any screen capture tools and place instructions on your screenshot.
- Make sure you resize your image to match your dashboard layout size. In our example, our dashboard layout is 1200×700. Save your image to a folder of your choice.
- Bring a floating layout container (horizontal or vertical) and resize it to 1200×700.
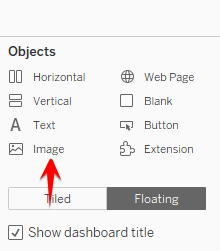
- Using the objects menu at the bottom of your dashboard, use the image option to bring your image to the dashboard.
- Drop this image into the layout container and ensure that you change the background image to white. This ensures that the help screen/ instructions are always on top when we show it.
- Next select your layout container and edit it for when you hide or show the image we just added as shown in the screenshots below.
- Now use the toggle to show or hide the instructions. An example is shown in the screenshot below.

How about using the hidden containers feature to improve OBIEE data visualization in Tableau? You’re just a click away!
Try BI Connector now!!