
August 27th, 2019
BI connector v2.1 with Reports connector Released
We recently released BI connector v2.1, the next generation integration between Tableau and OBIEE. The new release allows you to connect seamlessly to OBIEE subject area and reports with Tableau. In addition, it includes enhancements in the connectivity from Tableau to OBIEE, so we recommend existing users of BI connector to upgrade.
New Features
Try BI connector Free for 30 Days
Connect to OBIEE reports from Tableau
With BI connector v2.1, you can connect from Tableau desktop or server to OBIEE reports catalog and create Tableau visualizations from existing OBIEE reports. This is useful in several scenarios:
- Your organization would have created hundreds/thousands of OBIEE reports over several years. Instead of manually exporting data into excel and then importing into Tableau, you can save time, eliminate human errors by using BI connector to visualize the OBIEE reports data with Tableau.
- Instead of spending weeks or months and expensive consultant hours to recreate the OBIEE reports from scratch in Tableau, you can use BI connector to quickly create modern Tableau visualizations for pre-existing reports in just a few minutes.
- OBIEE reports typically have a number of columns, but end users might need only a few columns for their business analysis. Different users might require different columns. With BI connector, users can choose the columns that they need from OBIEE reports and create their own visualization.
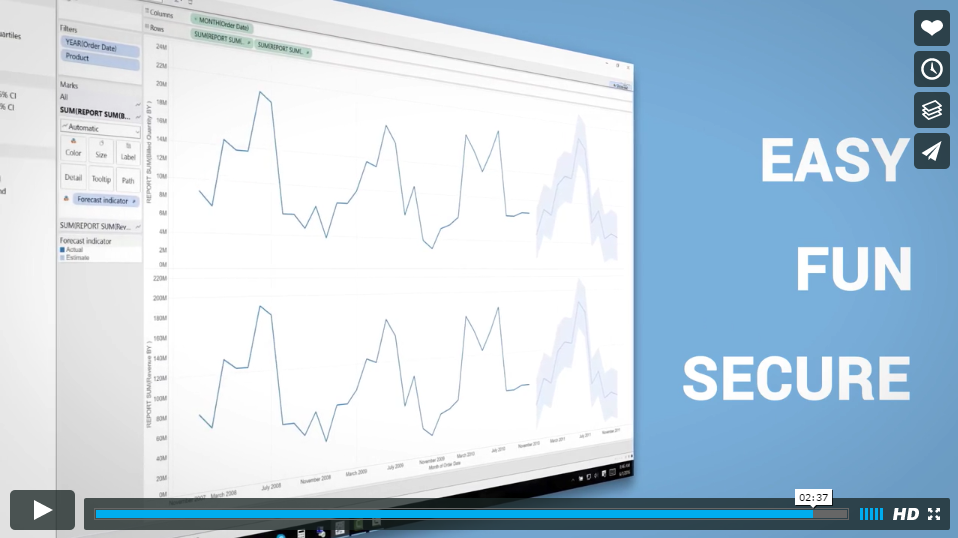
Check out the video demo of BI connector Reports connector:
Tableau to OBIEE Session Optimization
BI connector v2.1 reuses a single session per user per OBIEE connection from Tableau. This saves resources both from a client and OBIEE server perspective and eliminates multiple sessions in OBIEE for the same user. You will notice the following changes in Tableau:
- OBIEE Server name will be displayed in Database pull down list.

- Subject Areas or Reports (depending on what you choose to connect to) will be displayed in Schema pull down list.


30 Days Free Trial
Thanks to your feedback, we have increased the free trial period from 14 days to 30 days. We hope that this extended trial period provides you with adequate time to test drive BI connector amidst your busy work schedule and see the value of BI connector.
Download
You can download the latest version of BI connector from Free Trial page.
Try BI connector Free for 30 Days
You can try Reports connector (along with Subject Areas connector) free for 30 days using the license key here.
Upgrading from BI connector v1.0 to 2.x
Please refer to the instructions in our Knowledge base.
If you have an existing license key for Subject Area, you need to use the new trial license key to test drive Reports connector. If you use your existing license key (with Subject Area connectivity only) your reports will not be displayed in Tableau.
We need your feedback
We need feedback about what’s working and what’s broken in order to help everyone get the most out of BI connector 2.x. Share your feedback via email to [email protected].
We’re super excited about releasing 2.x, and we value your feedback. So please let us know what you think!