
August 27th, 2019
Connect from Tableau to OBIEE Reports Catalog
Every organization that is using OBIEE has hundreds, if not thousands, of OBIEE reports developed over several years after spending millions of dollars. These reports, which are consumed by wide range of users across the organization, contain trusted data and are critical for the business. But the reports often look dated, have tens of columns that are never used, and users are frustrated with the lack the options to personalize the report or visualization.
IT, on the other hand, has spent months and years to develop these OBIEE reports. They put together a robust OBIEE security model to ensure that right people have access to the right reports with the right data. When users require changes to these reports, the burden falls back on IT to implement these changes. As a result, the BI backlog keeps growing and overwhelms the IT team.
When Tableau is introduced in an organization that is using OBIEE, there is no way to reuse the existing OBIEE reports and make them available to Tableau users. Organizations often spend months/years of time and hundreds of thousands of dollars in consultants’ hours to recreate the reports in Tableau and test them again for information consistency. Needless to say, this is an extremely inefficient, time-consuming, and expensive approach.
Connect from Tableau to OBIEE Reports
Today, we are introducing the BI Connector add-on module (beta) that eliminates the inefficient, out-dated, manual approach of redeveloping OBIEE reports into Tableau reports. The new BI Connector Reports module enables Tableau users to connect directly to OBIEE Reports catalog, reuse the existing OBIEE reports meta data, query the reports, and visualize the data the way they need it in Tableau.
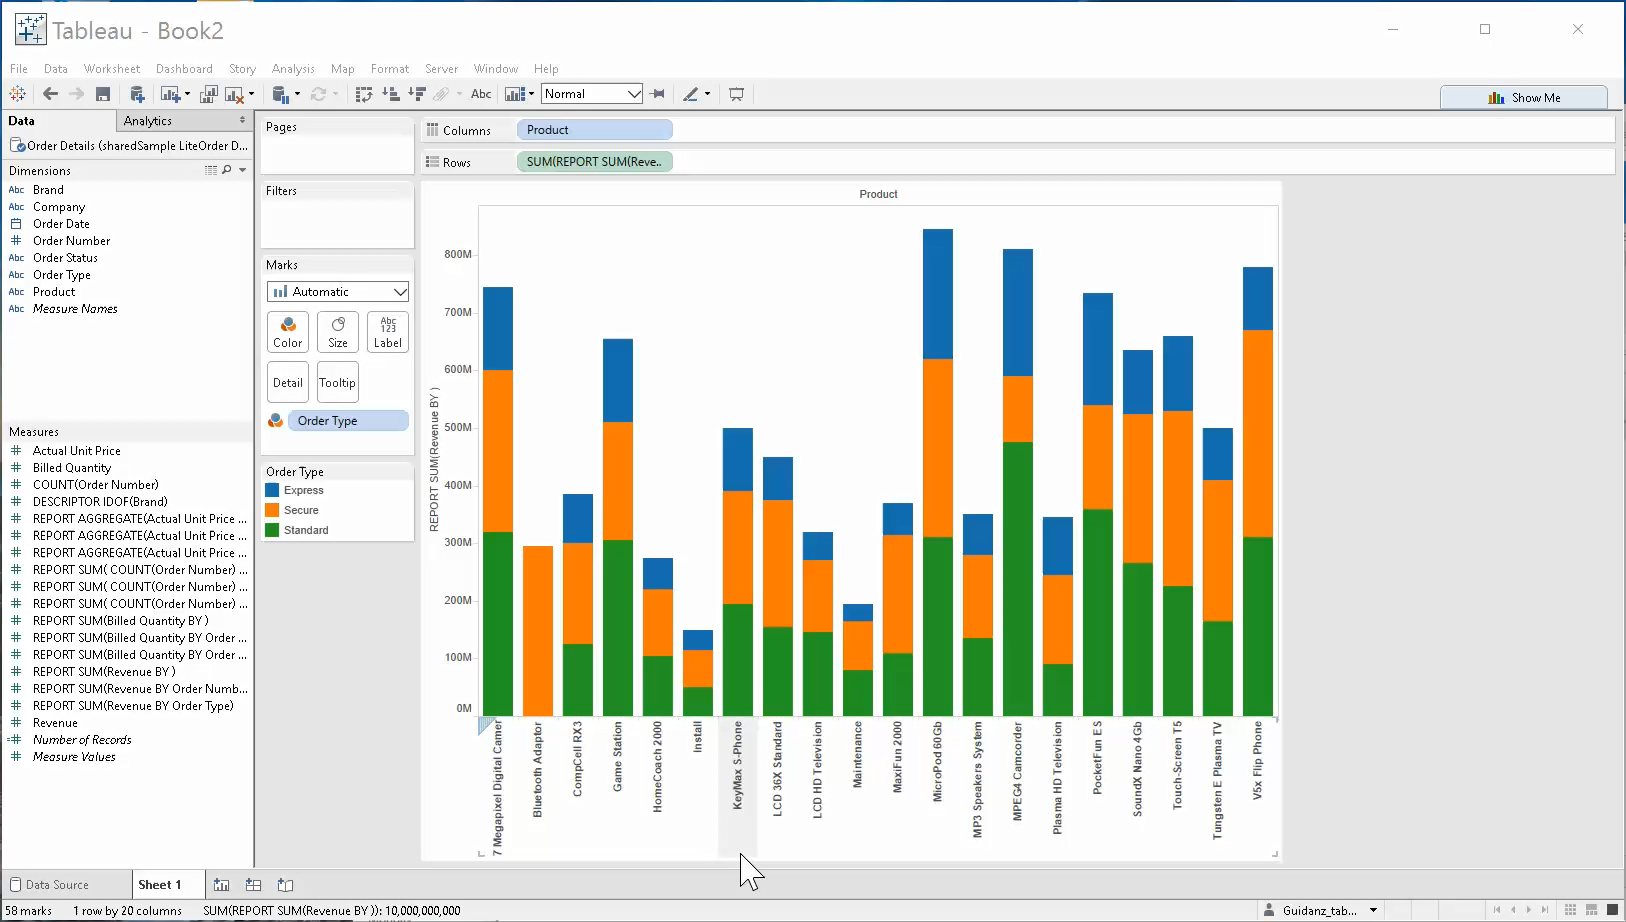
Using the Reports option in BI Connector, users can connect directly from Tableau to OBIEE reports catalog.

Since BI Connector uses OBIEE security model, users see only the reports and data that they are permitted to see.

Each report is displayed as a table in Tableau.

Users can visualize the reports using Tableau’s modern visualization or extract the data into Tableau with ease if needed.

All the report queries reuse OBIEE meta data and queries are executed in OBIEE. Any hard-coded built-in filters in OBIEE reports are automatically reused while users can create new filters in Tableau. Finally, users can personalize the report the way they need it, create Tableau dashboards, and publish them using Tableau server.
Efficiency and Empowerment
The significant advantage of the BI Connector Reports add-on is the time savings that you achieve by reusing the existing reports in Tableau without making any changes in OBIEE. At the same time, the IT department saves time and money by not having to recreate the business critical reports in Tableau. Instead of reinventing the old reports, time and money could be wisely invested in creating new visualization and analysis from OBIEE data.
The secondary advantage of the BI Connector Reports add-on module is the governed self-service capability that is now available to end users. Tableau users are able to personalize the visualization of OBIEE reports with ease and do not have to depend on IT for visualization changes. They can gain new insights by blending OBIEE reports data with other data sources. With just a few clicks of the button, IT is now able to offer a governed self-service capability for OBIEE reports to business users and meet their modern visualization requirements.
Try BI connector – Reports Connector Free for 30 days
We invite you to try BI connector free for 30 days. You can download BI connector from the Free Trial page.