
Visualizing OBIEE data in Tableau Desktop
In the two previous blogs, we looked at how to install and connect to OBIEE subject area in Tableau using BI Connector within a matter of minutes, without any changes to OBIEE and without any help from your IT.
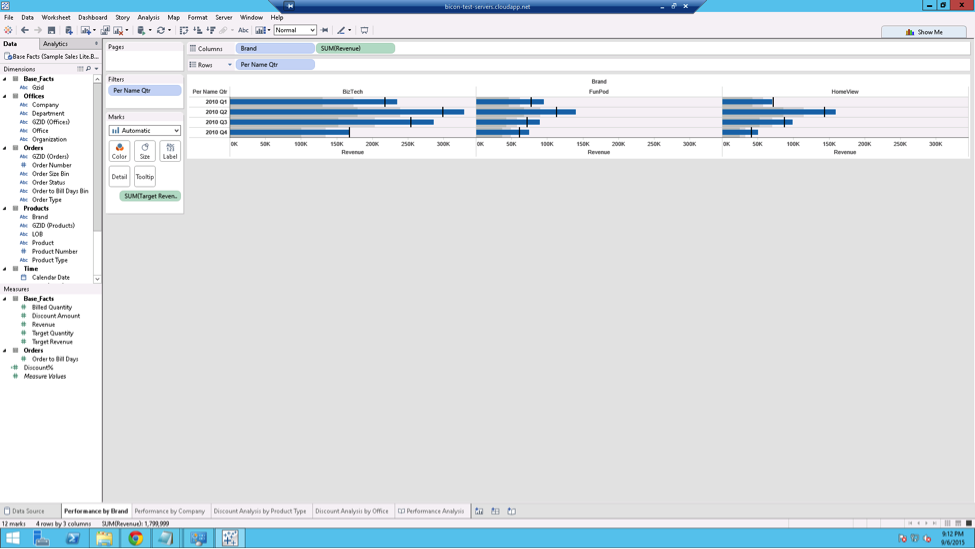
Now, let’s see how the OBIEE subject area folders look like in the worksheet.

We saw that the folders in the OBIEE subject area “Sample Sales Lite” are tables in Tableau. The fields in the folders in OBIEE are now columns inside the table in Tableau. Now OBIEE just looks like connecting to a database like Oracle from Tableau’s viewpoint!
We recommend hitting the “Auto pass updates” at the top before dragging any column on to the worksheet. This will prevent getting more data than needed into Tableau.
Once the pause button is hit, drag the required fields on to the worksheet. In this case we are pulling the Quarter from Time, brand and product from Product table and Order Number from order table and finally the Revenue amount from the Base Facts table. Now to get only the data we need filter by quarter. Then hit the Play button. Now it will run the query on OBIEE get the data into Tableau and you are all set on visualizing the data the way you want in your favorite BI tool!