
October 12th, 2022
How to Simplify OBIEE Data Visualization?
Introduction
Oracle Business Intelligence Enterprise Edition (OBIEE) is a BI and Analytics platform. It has an edge over data management but lacks self-service and data visualization capabilities.
BI tools of today modernized the analytics experience with a self-service model. It enhanced data visuals for faster decision-making.
In this article, learn how to overcome Oracle’s data visualization limitations.
What Is Data Visualization?
Data wrangling is the process of transforming a “raw” data form into another format.
Data visualization represents data in the visual form of pie charts, histograms, corporate graphs, etc.
The graphical view allows you to easily analyze data, outliers, and patterns.
You can spot trends that might go unnoticed with a spreadsheet of raw numbers.
Big data visualization projects use more complex visuals form as heat maps and fever charts.
The biggest tools in this marketplace include:
- Microsoft Power BI
- Tableau
- Qlik
OBIEE Data Visualization Limitations

1. Lack of Features
OBIEE’s graphical features are cumbersome and limited. It lacks a simple drag and drop feature and options to create advanced visuals, like maps.
OBIEE offers restricted visuals such as simple bars and pie charts.
There is no way to create data sets in a pictorial way for simple analysis.
To help users overcome the drawbacks of OBIEE, Oracle introduced cloud services: Oracle Analytics Cloud (OAC)
Oracle Analytics Server (OAS) was developed to replace OBIEE 12c. It is the on-premise version of OAC.
However, business users still prefer Power BI or Tableau.
2. Lack of Self-Service
Self-service BI tools allow non-tech users to be involved in the data analysis process. It enables users to process data without seeking help from the IT team.
OBIEE is strong in its ability to connect with databases but is not self-service friendly. You may have to rely on the IT teams for simple analyses.
Power BI & Tableau has the upper hand in terms of self-service.
3. Not User Friendly
OBIEE is difficult to use in comparison to other BI tools. Its data mashup feature and ease of use for end-users needs improvement.
OBIEE also has a complex dashboard. The user requires technical know-how and hours of time to create simple visual reports.
How to Simplify Oracle OAC & OBIEE Data Visualization?
Method: Connect a self-service platform to OBIEE
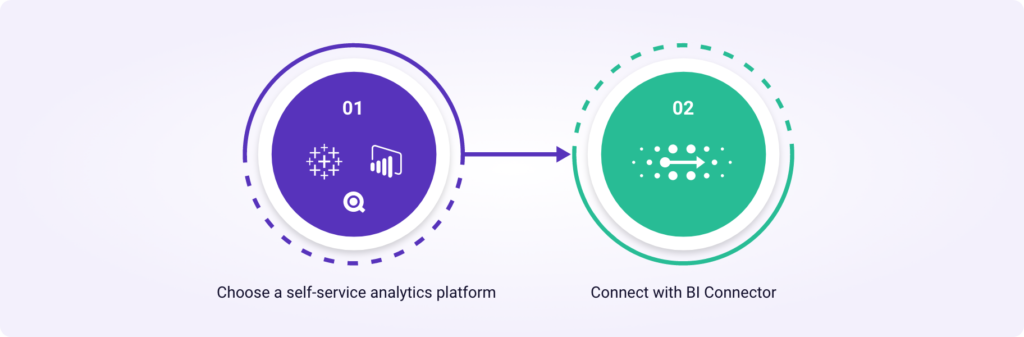
1. Choose a self-service analytics platform
Replacing OBIEE with a self-service analytics platform such as Power BI/ Tableau is the ideal choice.
- Power BI
Power BI is a powerful suite composed of tools that provide the best solutions for BI and Data Mining Queries.
OBIEE vs Power BI: A Quick Comparison
- Tableau
Tableau is a leading data visualization tool used for reporting and analyzing vast volumes of data.
Tableau vs OBIEE: A Quick Comparison
- Qlik
Qlik Sense is a data visualization Desktop application in Windows. It allows users to create data visuals, charts, and interactive dashboards for offline usage.
2. Connect using BI Connector
BI Connector is an ODBC-based connector for Oracle BI (OBIEE, OAC, and OAS) data sources. It allows you to connect Power BI or Tableau (both Subject Areas & Reports) to Oracle BI.
You can download its Desktop and Server Edition for a free 30-day evaluation. It is compatible with desktop & server editions of your favorite BI tools.
Test out the data preparation and performance in Tableau or Power BI.
Get started with BI Connector and create an intuitive visual project in minutes.
Benefits
1. Eliminate the risk of migration
There are no tools to automate the migration from OBIEE to Power BI or Tableau. The entire process is manual.
OBIEE migration projects involve all kinds of security risks:
- Data loss
- Compliance violations
- Contractual breaches
- Insecure APIs
- Accidental errors
You can connect a self-service platform to OBIEE to eliminate the risks of migrations.
2. Save time
To export and import, OBIEE data manually can take around 4 to 5 hours a week.
These hours when monetized, result in a productivity loss of about $10,000/user/year.
If your company has 100 users, the productivity loss amounts to $1M.
Hence, it is time-efficient to connect a self-service platform to OBIEE using BI Connector.
3. Get support for live queries
A live query, once activated, remains active by default. It monitors the database for changes; refreshes the result set whenever a change occurs.
BI Connector supports both Live and Import modes.
Web Data Connectors such as Unify do not support live queries of OBIEE data.
4. Eliminate the need to re-engineer OBIEE
You can use the Oracle BI Server ODBC Driver to connect almost any self-service platform to OBIEE.
However, the downside is the need to re-engineer OBIEE.
When you choose to connect a self-service platform to OBIEE, you’re making use of your existing OBIEE assets.
This eliminates the need to re-engineer OBIEE from scratch in the modern BI tools.
Conclusion
OBIEE is strong on the data management side. Whereas modern BI tools are strong on the data visualization side.
Users need both for effective analytics.
Since migration is risky, connecting BI tools to OBIEE is the smart approach.
BI Connector is the best choice to connect OBIEE with self-service platforms. It is a secure and hassle-free way.