
June 2nd, 2023
The Ultimate Guide to Oracle OBIEE Data Visualization
Your Key Takeaway
In this blog post, you’ll know how to overcome OBIEE’s data visualization limitations without cumbersome excel exports or expensive re-engineering.
If you’re not familiar with OBIEE, no worries! We’ll go from scratch. First, we’ll cover what’s OBIEE, followed by its architecture and features, with a quick analysis of its pros and cons. We’ll also compare OBIEE with other tools, and share the ways to simplify OBIEE data visualization.
In short, this blog post will serve as your go-to resource for simplifying your Oracle OBIEE data visualization.
What is Oracle OBIEE?
Oracle Business Intelligence Enterprise Edition (OBIEE) is a traditional BI and Analytics platform used by enterprise companies for around a decade.
OBIEE was one of the most-sought BI platforms by enterprises, until the leading data visualization tools of today flooded the market and revolutionized the analytics experience with a self-service model.
In today’s scenario, where data-driven decision-making is new normal, maintaining a single source of truth alone is not enough to meet user demands. The users want to visualize the data in a self-service model. This important piece is missing in OBIEE.
Despite the absence of true self-service capabilities, OBIEE still maintains an edge over the modern data visualization tools from a data management perspective.
At present, a large number of enterprises using Oracle OBIEE have already created a single source of truth with decades of effort and investment. OBIEE is in fact, an organizational asset for these companies as effective data management is a necessity for data-driven business decisions.
OBIEE Architecture
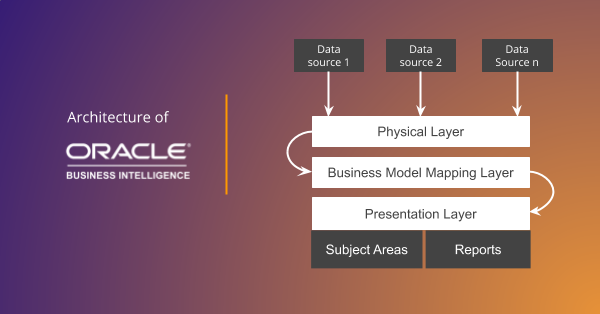
The OBIEE has 3 layers at a high level:
- Physical layer
- Business Model Mapping layer
- Presentation layer
Physical layer
In simple terms, the physical layer is where your OBIEE gets directly connected with your different data sources.
Some of the commonly used data sources are:
- Customer Relationship Management (CRM) system
- Accounting systems
- Inventory/stock management systems
- Human Resource Management (HRM) system
- Project management tools
or any other application or tool, the data from which helps in making business decisions.
The physical layer serves as your OBIEE’s touchpoint with the different data sources and helps you access the data on an as-is basis. In other words, you can access the raw data in the physical layer.
In the physical layer, you can also schedule data refresh, or manage live connectivity with your data sources, based on the options available in each of them.
Business Model Mapping Layer
The attributes of the data in each data source connected to your OBIEE’s physical layer could vary a lot. For example, consider the following scenarios:
- Your CRM could have location (or address) fields, say State stored as abbreviations (say TX, instead of Texas) while the State field is used for storing the complete state name in your HRMS.
- Your Accounting and CRM systems could have a common data point, that’s either unique for each record or not unique. In this case, you may have the possibility of eliminating redundant columns/rows of data to run your queries faster.
In this case, you cannot combine the data from your CRM and HRMS for analysis until they all use the same format.
You may experience slower queries if you don’t eliminate the duplicated rows/columns.
There are many such scenarios we could talk about.
OBIEE’s Business Model Mapping layer helps you navigate all such scenarios successfully. You can structure/format the incoming data in the Physical layer with the Business Model Mapping layer. The Business Model Mapping layer also enables you to perform calculations to your dataset.
You can also create and manage custom dimensions in the Business Model Mapping layer.
Presentation Layer
The Presentation Layer is where the data processed in the Business Layer is organized in an analytics-ready and structured format, for performing data analysis.
The data is managed in Subject Areas, as well as Reports, which are in turn created based on the Subject Areas data.
Each Subject Area has fact and dimension tables, and their relationships are defined based on the Star or Snowflake schemas.
The role-based data access privileges are also managed in the Presentation layer.
The data in the Presentation layer is your organization’s single source of truth. The end-users consume data from the Presentation layer and perform their data analysis.
OBIEE Features
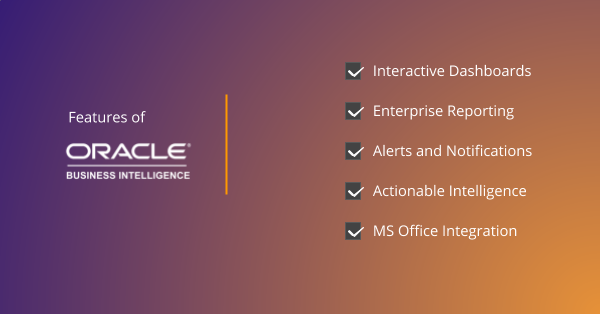
Now let’s take a quick look at the features of Oracle OBIEE. Here’s a quick list of the key features of OBIEE:
- Interactive dashboards
- Enterprise reporting
- Alerts and notifications
- Actionable Intelligence
- Microsoft Office integration
Interactive Dashboards
Interactive dashboards are essential for BI & analytics. Oracle OBIEE provides the interactive dashboards feature. You can create different reports using visuals, and place the critical reports in your OBIEE dashboard. The interactive dashboard feature plays a critical role in enabling business users to have a quick view of essential data.
Enterprise Reporting
The enterprise reporting feature helps IT teams create and publish reports for use by multiple stakeholders, based on each of their data access privileges. The feature also equips the users to create formatted report templates and documents for reuse.
Alerts and notifications
In OBIEE, the users can set up alerts (and get notified proactively) triggered by conditions based on their individual needs. It could be anomaly detection in the data or a certain data point reaches a threshold level or any other scenario on which a user wants to be alerted, in order to take appropriate action. The users can also set up preferences over the medium or channel through which they want to be notified.
Actionable Intelligence
The Actionable Intelligence feature of the OBIEE equips users to set up an action based on an event. The event technically is a certain condition met by the data, which when triggered, can invoke a business process usually through web services. For example, if the Inventory level is nearing the threshold for a refill, the Purchase Manager can use the Actionable Intelligence feature to place an order to a vendor.
Microsoft Office Integration
OBIEE allows users to integrate with their Microsoft Office solutions and provides convenience to embed the reports in presentations/word documents. This feature provides additional ease of use for Microsoft shops.
Oracle OBIEE’s Advantages and Disadvantages
In this section, we’ll take a quick look at the advantages and limitations of Oracle OBIEE.
Advantages of Oracle OBIEE
Data Management is a mission critical part of Analytics. Creating a single source of truth is one of the primary goals of effective Data Management.
The main advantage of Oracle OBIEE is its Data Management capabilities.
OBIEE, despite being a traditional BI tool, is still used by many organizations because it is an organizational asset for them!
Surprising? Yes, it’s true!
These organizations have already invested heavily in OBIEE over the years, and built a single source of truth. They have already established connectivity from OBIEE to the different data sources and the systems they use. Further, the data governance policies must also be implemented in OBIEE over its decades of use.
In OBIEE, it is easy to connect to the different data sources like XML files, denormalized datasets, multi-dimensional data etc., using the readily available adapters. OBIEE equips the IT teams to structure, format and maintain complex datasets consistently for years!
Limitations of Oracle OBIEE
In recent years, the modern BI platforms like Power BI, Tableau, Qlik etc have taken the Business Intelligence landscape by storm.
The users of OBIEE have started sensing the absence of the data visualization features in it. The end-users rely heavily on the IT teams even for visualizing data with simple bar and pie charts.
However, the users are no longer interested in waiting for the IT teams to create and publish data visualizations, but want to create data visualizations with simple drag and drop actions.
Therefore, the downside of OBIEE is – it’s not self-service friendly, and that ultimately defeats the purpose of modern analytics, where self-service analytics is inevitable.
To help users overcome this data visualization limitations of OBIEE, Oracle introduced the Oracle Analytics Cloud (OAC) and Oracle Analytics Server (OAS – the on-premise version of OAC).
Many organizations using OAC or OAS still prefer trying tools such as Power BI, Tableau etc, as most users are already familiar with using those platforms.
Oracle OBIEE vs Power BI vs Tableau
In this section, let’s compare OBIEE with 2 data visualization tools – Power BI and Tableau.
| Factor | OBIEE | Power BI | Tableau |
| Self-service capabilities for end-users | No, high dependence on IT teams | Yes | Yes |
| Ease of using complex schemas | Quite easy | Complex, Star schema is recommended. Offers flexibility with cross-filtering options | Complex, Star schema is highly recommended |
| Data visualizations | Difficult to create | Easy to create with simple drag and drop actions, even for advanced visuals, like maps | Easy to create with simple drag and drop actions, even for advanced visuals, like maps |
| Data Management | Easy | Has inbuilt options for basic ETL functions | ETL tool is available at additional cost |
| Data source connectivity | Has inbuilt connectors for fewer, widely used data sources | Has a relatively more inbuilt connectors covering more data sources | Has a relatively more inbuilt connectors covering more data sources |
| Data blending options with external data sources | Difficult | Easy | Easy |
| Scalability friendliness | High | Low | Low |
Simplifying Oracle OBIEE Data Visualization
In this section, we’ll see the different ways to simplify Oracle OBIEE data visualization and outline each of their pros and cons.
If you’re techsavvy, you may want to check out the Clearpeaks’s OBIEE Customization series.
Now let’s see the list of the commonly used ways to simplify Oracle OBIEE Data visualization:
- Migrating to a self-service analytics platform
- Export and visualize OBIEE data in a self-service analytics platform
- Connecting a self-service platform to OBIEE
Migrating to a self-service analytics platform
Replacing OBIEE with a self-service analytics platform such as Power BI or Tableau is the ideal choice.
However, there are no tools to automate the migration from OBIEE to Power BI or Tableau. The entire process is manual.
The migration process involves the following steps:
- Rebuilding the connectivity to each data source involved
- Recreating the data relationships, calculations and processes
- Redeveloping the reports
- Implementing the data governance policies in the new platform
Based on our interaction with customers, we found that the average cost of migrating one Subject Area is $250,000, and demands a turnaround time of about 6 months.
So, if you have 10 Subject Areas, the estimated cost of the migration is $2.5M and takes a span of about 5 years.
The risk involved in OBIEE migration projects is inevitable, and it’s always good to start big projects that demand a huge amount of time and money investment with a risk assessment.
If your organization has the budgetary muscle and the patience to reap benefits, the migration is a good choice, provided you help end-users with an alternative solution until the migration project gets completed.
Export and visualize OBIEE data in a self-service analytics platform
We’re covering this option because it’s one of the possible ways to OBIEE data visualization with a self-service BI platform, but in the most unproductive way!
When you’re exporting and importing data manually from OBIEE to a self-service analytics platform, you’re prone to spend about 4 to 5 hours every week in the export process and recreation of the data relationships.
This 4 to 5 hours when monetized, results in a productivity loss of about $10,000/user/year. If your organization has 100 users, the productivity loss amounts to $1M.
The disadvantages of this option far outweighs the benefits, and hence, it is better to not use this option at all!
Connecting a self-service platform to OBIEE
If your organization decides to eliminate the risk of migration, the best choice is to connect your self-service platform to OBIEE in a bimodal approach.
The Integration option enables you to effectively complement the limitations of OBIEE. In fact, OBIEE is strong in the data management side, while the modern BI platform is strong in the data visualization side. Both are needed for effective analytics.
When you choose this option, you’re making use of your existing OBIEE assets, and eliminating the need of re-engineering them from scratch in the modern BI platform.
But the question is – Are there any connectors for integrating a self-service analytics platform to Oracle OBIEE?
Well, the answer heavily depends on the “self-service analytics platform” you choose! As of now, there are the following 3 options to integrate a self-service BI platform with OBIEE:
- Oracle BI Server ODBC Driver (almost for any modern BI platform)
- Web Data Connectors such as Unify (for Power BI and Tableau)
- BI Connector (for Power BI, Tableau and Qlik)
Let’s quickly take a look at the advantages and disadvantages of these options.
Oracle BI Server ODBC Driver
You can use the Oracle BI Server ODBC Driver to connect almost any self-service platform to OBIEE. With this driver, you can connect directly with your OBIEE DSNs and make queries in the live data.
However, the downside is that it’s very difficult to make the driver work consistently, and users will need the technical assistance to get them sorted out each time.
The other major disadvantage is the need for re-engineering in OBIEE. The key fields must be exposed in OBIEE RPD in business and presentation layers for each folder/table that is to be analyzed in the modern BI platform.
Web Data Connectors such as Unify
Web Data Connectors are generally a Javascript code in an HTML file for connecting two platforms.
Unify is one such Web Data Connector known to connect Power BI or Tableau to OBIEE.
The advantage of Unify is it enables users to connect to preconfigured queries of your OBIEE data from your preferred data visualization platform. It retains your OBIEE joins of the preconfigured queries, along with your OBIEE security framework.
The downside of Unify is it doesn’t support live queries of your OBIEE data, and is frequently prone to OBIEE (or the new data visualization platform) version compatibility issues. Unify doesn’t handle union reports or complex reports with subqueries.
BI Connector
BI Connector is an ODBC-based connector for integrating the leading self-service data visualization platforms to Oracle BI (OBIEE, OAC and OAS) data sources.
BI Connector currently integrates Power BI or Tableau or Qlik to Oracle OBIEE securely and seamlessly, in minutes. It meets all the following critical requirements to connect to OBIEE:
- Connect your favorite BI tool to both OBIEE Subject Areas and Reports
- Retains your OBIEE Subject Area table joins in simple steps
- Supports both Live and Import modes
- Compatible with the latest versions of your data visualization platforms and OBIEE
- Supports both Desktop and Server editions
- Connects to OAC and OAS also, apart from OBIEE
The only downside of BI Connector is it has a license fee that’s priced based on the number of CPU cores (starting at 8 cores) on the Power BI Gateway (or) Tableau Server (or) Qlik Server. For Tableau Cloud, the pricing of the Server edition is based on the total number of users (including all Creators, Explorers, and Viewers on Tableau Cloud).
In a security perspective, the desktop edition of BI Connector requires the user’s OBIEE credentials to connect to the data they are permitted to access in the OBIEE end. In the cloud editions, you have to implement data security for OBIEE, like you do for any other data source.
Conclusion
Since migration is highly risky, connecting a data visualization platform to OBIEE is the smart approach. BI Connector, as a battle-tested solution, trusted by large enterprises (like McAfee, McDonald, Oliver Wyman), is the best choice to visualize your OBIEE data in a hassle-free way.