

October 7th, 2021
Power BI: The Jumpstart Guide for Beginners
What is Power BI?
Power BI is Microsoft’s BI and Analytics platform. It is the most widely used data visualization tool and has penetrated into almost all industries and geographies, in less than a decade.
Power BI, due to its affordability, drastically increased the user base for data visualization tools. The new normal is that data visualization is not only meant for the C-level executives, but also for users at all levels of the organizational hierarchy.
Even from an operational standpoint, organizations use Power BI to track and alert stakeholders when a certain metric exceeds or goes below a threshold level.
Microsoft is repeatedly positioned as a leader in Gartner’s Magic Quadrant for the BI and Analytics platforms, for 14 consecutive years. The fact speaks for itself!
Microsoft conducts the Dashboard/Analytics in a Day training as a virtual event frequently.
This helps professionals from different industries to learn and start using Power BI, just with a day of training.
Power BI components
In this section, we’ll take a quick look at the following five critical components of Power BI.
- Power Query
- Data Analysis Expressions (DAX)
- Data Modeler
- Reporting canvas
- Performance Analyzer
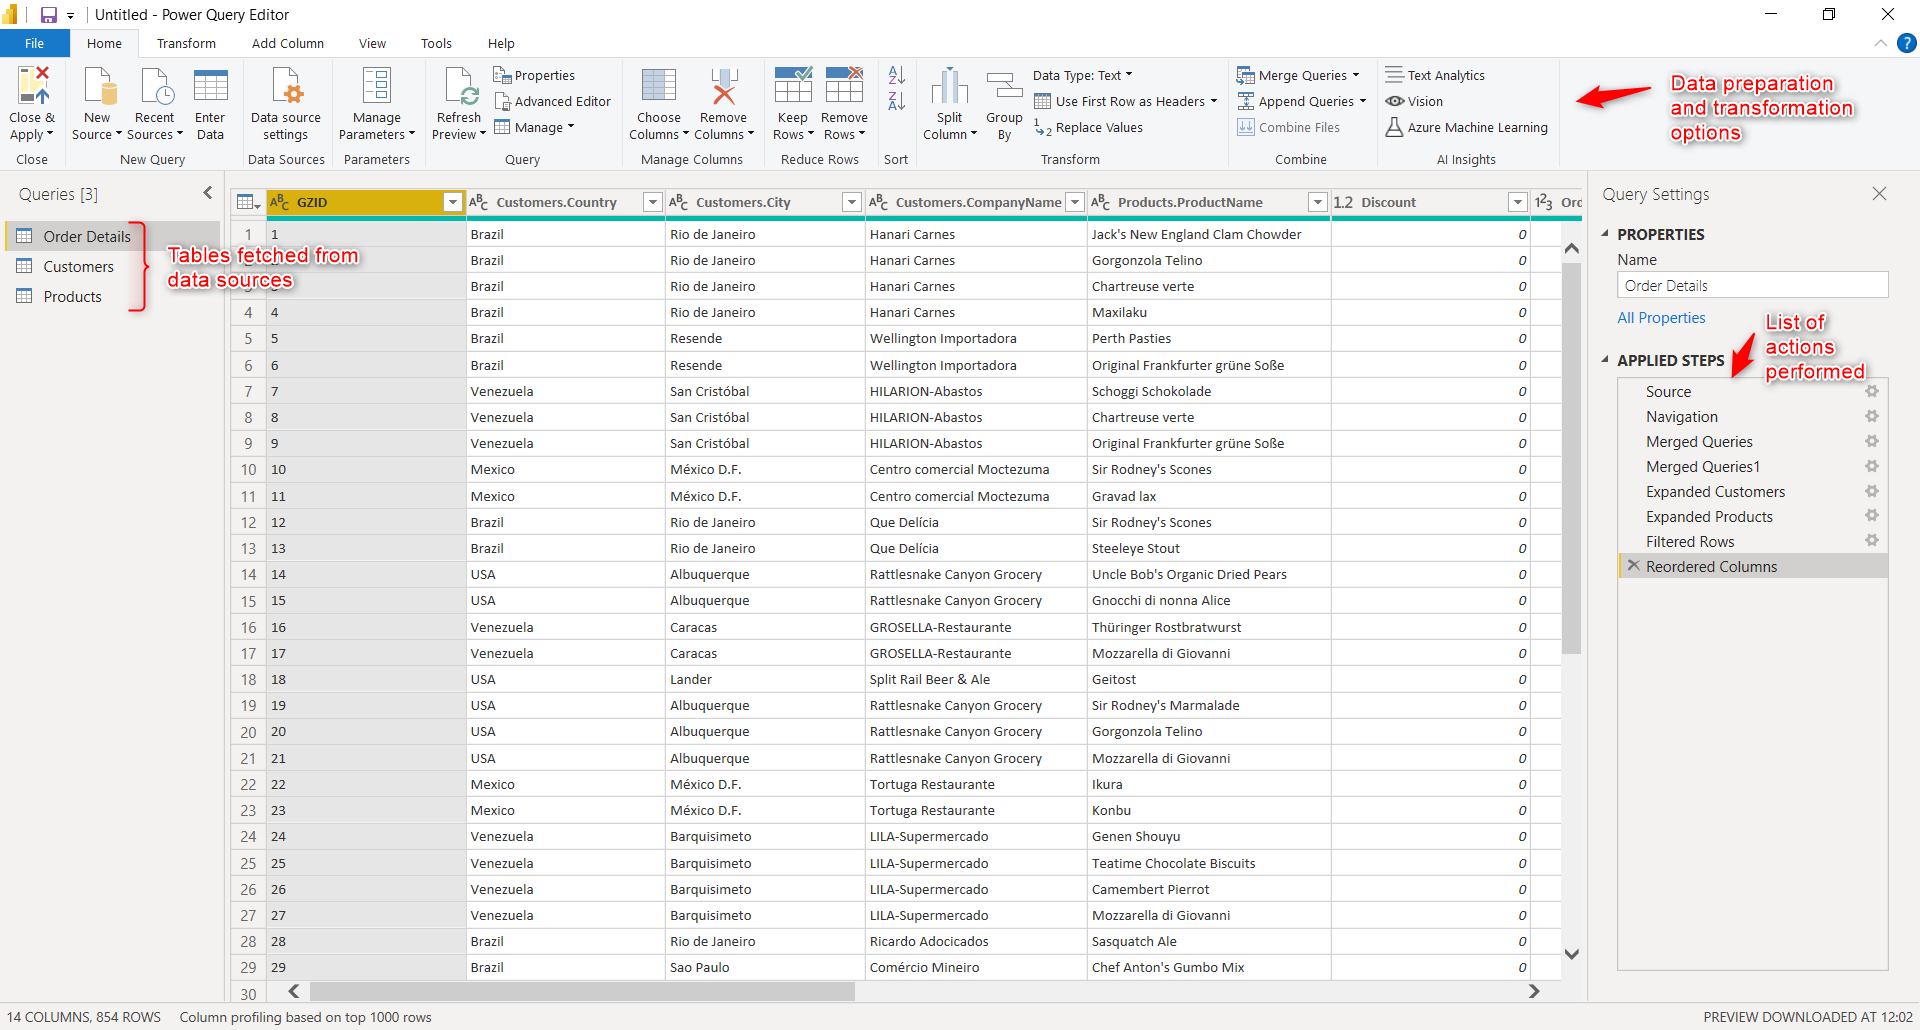
Power Query
The Power Query helps you to connect to data sources, and shape (structure, transform, format) the data in order to make it analysis-ready.
Power Query runs on M. The Power Query editor window helps you to achieve most actions such as formatting data, transforming data, adding/merging columns, keeping the first row as header, and so on.
If you’re not finding a relevant option, you can directly program the action in M and get it executed.
This video is proof of how the Power Query editor simplifies the job of merging fact table data with multiple dimension tables’ data when connecting to OBIEE Subject Areas data source.
Data Analysis Expressions (DAX)
DAX comes into the picture when the users face scenarios such as creating a new column for categorizing data (say high, low, medium, etc) by fixing ranges for data in other columns.
Sometimes, the users want to see the data as aggregates or percentages for more insights. In such cases, they can use DAX and create calculated columns as well.
The use cases mentioned above are just examples. You can always refer to Microsoft’s DAX documentation to learn and master DAX. The DAX Guide is also a rich DAX resource.
DAX works not only with Power BI but also with Microsoft Excel’s Power Pivot.
Data modeler
When you’re fetching data from multiple tables across different sources, you’ll need to create relationships between them.
This is exactly where the Data Modeler tool comes into the picture. You can simply select the column that can be used for the relationship, and set cardinality and cross-filter direction in a matter of a few seconds.
Here’s a quick example of how the Data Modeler is used to retain the joins in OBIEE Subject Areas.
Reporting canvas
The Reporting canvas is the user’s playground. Just select visuals, and drag-and-drop the fields you want to visualize.
You can conveniently add filters, and format the visual, show the appropriate labels, and create a great storyboard.
Power BI’s report interactiveness makes it easy to unlock insights much faster. You can place all critical reports in a single reporting canvas and make it a dashboard, with drill-down, and drill-through options.
Performance Analyzer
Power BI also provides a performance analyzer tool, just in case, your Power BI report performance is not up to the mark.
All you have to do is open the performance analyzer tool, and see which query or action is consuming a long time to get executed. Once you identify the troublesome query, you can always play around with different options to improve the report performance.
Top Reasons for Power BI’s Widespread Adoption
In this section, we’ll see some of the top reasons why most companies use Power BI for Enterprise Analytics.
Below is the list of reasons, and we’ll briefly run through each of them!
- Connectivity to a wide set of data resources
- Data preparation friendly with in-built ETL options
- Self-service data visualization
- Collaborative use
- Data security
- Flexible pricing and scalability options
- Interactive community forum
- The Power BI talent pool
- Used together with Power Apps and Power Automate
- Strong partner ecosystem
- R and Python scripting for Data Science
- Natural Language Processing (NLP) capabilities
- Augmented BI
Connectivity to a wide set of data sources
Power BI is rich in data source connectivity options. As a Microsoft product, it readily connects with the Microsoft line of products, be it Microsoft Dynamics CRM or SQL Server database or Azure cloud suite.
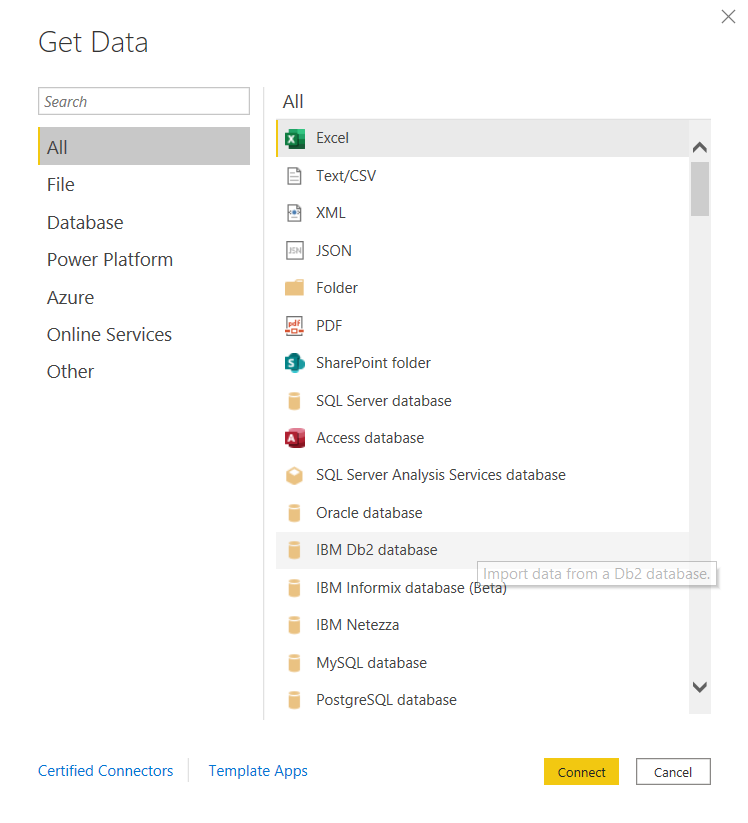
Power BI connects with many widely used non-Microsoft data sources as well, such as Oracle Database, Amazon Web Services, Google Query, Snowflake to name a few.
Adding to this, Power BI provides inbuilt connectors for data sources such as Salesforce, LinkedIn Sales Navigator, Quickbooks, Marketo, Zendesk, Asana, Automation anywhere, to name a few.
Power BI has inbuilt/certified connectors for other BI tools as well, especially Microstrategy, Oracle BI Stack – OBIEE, and Oracle Analytics (OAC/OAS).
Power BI has inbuilt connectors for leading NoSQL databases such as MongoDB as well. It also connects to data virtualization tools like Denodo.
On top of it all, Power BI provides a variety of options to connect to data sources in file format like Excel, PDF, XML. It is also possible to create custom connectors for any other data sources in Power BI using the options such as Blank Query, OData Feed, ODBC.
Data preparation friendly with in-built ETL options
The biggest hurdle for data visualization is data preparation. Power BI comes with handy, easy-to-use options to structure and format the data, improve data quality and fix the errors in the data.
For most use cases, the raw, as-is data fetched directly from the data sources is not analysis-ready. The users still perform operations such as merging or removing columns, formating data, setting the first row as header, applying data filters, and so on.
The Power Query Editor is a powerful tool to perform data transformations, adding/removing columns, merging/demerging data or creating measures. All these operations are easy to perform in Power BI, as long as you have a solid understanding of the raw data you fetch from your data source.
You can tap into the features such as datasets, dataflows, and views, and easily reuse the connectivity to the data sources, and transformations applied to the raw data.
Further, Power BI offers 2 modes of connectivity to the data sources – Import and Direct Query.
Self-service data visualization
Power BI helps users to visualize data with a few click, drag-and-drop actions.
Not satisfied with the color or label of the visual? Just head to the formatting pane, and you’ve got all the customization options, all in one place.
Want to visualize only specific data? Head to the filters pane, and you’ve got the required options to filter your queries. Data visualization is indeed a cakewalk for Power BI beginners too. So simple, and so easy!
Collaborative use
At the enterprise level, multiple users may want to consume the same report. Power BI offers the flexibility to publish reports to servers securely.
You can simply create a report in Power BI Desktop, and upload the pbix file in service in the appropriate workspace for sharing with other users. You can also download the file from the service in pbix format, and edit it.
There are many choices. You may publish to Power BI service (public/private), add access restrictions, and share the link with stakeholders. If you’re skeptical about the cloud, you can use the Power BI Report Server, and publish reports on your on-premise server using the Power BI Gateway.
Power BI also offers the flexibility to switch from Report Server to cloud anytime, if you change your mind.
Data Security
As for any BI tool, organizations are skeptical about data security and data governance. Power BI offers plenty of features to have control over your data.
For example, the organization’s financial information must be available only for the Finance department. Or, the data exclusively available for salesperson 1 should not be accessible for salesperson 2, and so on.
You can easily set up Row Level Security (RLS) or Object Level Security (OLS) in a few clicks in Power BI.
Flexible plans and pricing
Power BI plans and pricing is simple and transparent. Power BI Desktop is free for all users. The users can publish and consume public reports online as well.
However, if you’d like to restrict access to the reports, you can simply opt for Power BI Pro, which costs $9.99/month/user.
Power BI Premium is available on a per-user and per capacity basis. In April 2021, Power BI Premium was made available at $20/month/user.
On the other hand, if you need a set of dedicated resources reserved for exclusive use, you can opt for the per-capacity basis. With the per-capacity plan, you can equip all users to have access to Power BI Report Server as well.
In the per capacity premium plan, when there’s a sudden spike in usage, the organizations can enable the Autoscale option (which is in preview at the time of writing this post), and add a vCore for 24 hours, and pay only for that, rather than increasing the capacity permanently.
However, you must keep in mind that If you’re choosing Power BI Premium on a per capacity basis, you will still need Power BI Pro license to publish reports into the Premium capacity.
The affordability factor is one of the major reasons driving the widespread adoption of Power BI, in businesses from all industries and sizes.
Interactive community forum
The Power BI community forum is very interactive. When the users face any challenges with using Power BI, they can easily head to the community forum and post their problems.
The community forum is easy to use. For existing problems, if a solution was found, the solution will be linked right there on the problem page, in order to help users quickly find the solution.
In the Power BI community forum, apart from Microsoft employees (who act as Moderators), the users also help out each other by posting solutions to problems.
The Power BI talent pool
The Power BI talent pool of today is awesome, thanks to Microsoft’s Power BI certifications.
The talent pool for roles such as Power BI Administrator or Power BI Developer is easy to find.
There’s plenty of non-Microsoft blogs and youtube channels such as Guy in a Cube, RADACAD, Data Mozart, Apex Insights, to name a few, to learn Power BI tips and tricks for different, real-world use cases.
Used together with Power Apps and Power Automate
Power Apps helps users to build and deploy applications with low-code efforts.
Power Automate is used to create automation sequences between multiple platforms, again with low-code efforts.
Power BI, as a Microsoft product, syncs easily with Microsoft’s other no-code/low-code platforms, especially Power Apps and Power Automate.
Strong partner ecosystem
Microsoft, as for any of its products, has a strong partner ecosystem for Power BI as well.
The Power BI Partner showcase and Appsource portals provide access to the partner-built, deployment-ready, customizable connectors, visuals, dashboard, and reports solutions for a wide range of industries, and use cases.
R and Python scripting Options
Power BI offers the R and Python Scripting options for the custom visual geeks.
Some unique use cases demand visualizations that are not readily available in Power BI. In such cases, the R and Python geeks can still get the job done.
Apart from creating custom visuals, you can also run these scripts to import datasets into your data model.
Natural Language Processing (NLP) capabilities
Instead of searching for a Power BI visual, and drag-and-dropping the fields, you can also simply type a question in Natural Language like – What is the total revenue from the product x last year?
Power BI is powered with AI technology to understand natural language queries, and to fetch the answers for them.
Augmented BI
Forrester placed Microsoft as a leader in the Augmented BI space.
Making use of ML models, and uncovering patterns and insights out of your historic data is possible with Power BI in the BI and Analytics stack.
Convenience
Power BI is available as a mobile app for handy report consumption by users.
Further, Power BI also provides the necessary options to embed Power BI reports into your application stack. This makes it easy for the users to avoid opening a separate Power BI instance, by visualizing the critical data right there in the application they frequently interact with!
Adding to this, Power BI reports can be easily shared in Microsoft Teams, and PowerPoint presentations.
Conclusion
As a beginner, are you excited to get started with Power BI?
Just a quick heads-up. It may not be possible to become a Power BI expert overnight. But small, consistent efforts help to achieve the feat over a period of time.
Start simple! Just download Power BI Desktop, and connect it to a simple spreadsheet data source, and start visualizing!
Then you can easily build on the basics, build complex scenarios and solve them on a step-by-step approach.