

3 unusual visuals in Power BI with wide usage potential
Power BI is one of the best Business Intelligence platforms available in the market. Microsoft has been releasing new updates every month, and making sure they’re inching closer to fulfill the users’ needs/wants in each of the releases.
We, at Guidanz also love the latest features without doubt, but a month down the lane, these updates will become older, as the next set of new updates gets rolled out. At every release, the users focus primarily on the new updates and tend to lose focus on the older ones. This thought left us wondering if the existing features were utilized to their maximum potential!
Power BI’s updates are focused on multiple aspects – like workspace utilization, performance tuning, ETL etc. We chose to start with a single aspect – visuals, and identified 3 unusual visuals with wide usage potential. We’ll cover them in this blog post.
Here we go!
Before we dive into the visuals, please take a look at the Deals Data that will be used to explain the visuals. The spreadsheet has the following 12 data points pertaining to 120 deals closed by a firm in the last 5 years.
- Deal # (assigned in chronological order)
- Sales Team (A/B/C/D)
- Year (2014 to 2018)
- Month
- Quarter
- Account Type (SMB or Enterprise)
- Business Type (Existing or New)
- Account Ownership (Public or Private or Self-funded)
- Contract Type (Fixed Bid or Time & Material)
- Country (6 countries – US, Canada, UK, India, Singapore, Australia)
- Revenue
- Estimated margin
These data were generated using the RANDOM functions in excel. You’re welcome to download and use them, and try the following visuals.
The visuals we’re going to cover in this post are:
- Key Influencer Visuals
- Combo Chart Visuals
- Waterfall Visuals
Let’s take a look at them one by one.
Key Influencer Visuals
This visual is of great help whenever the decision-makers are tasked with determining the effect of one or more potential causes on a particular outcome.
Examples of use case scenarios include:
- Effect of customer country and account ownership on the contract type
- Effect of sales team and contract type over total sales
- Effect of each helpdesk member and subscription plan on overall customer satisfaction rating
- Effect of each marketing channel on leads generated
Note: Please note the last 2 examples are out of the scope of Deals Data, and provided for the reader’s understanding.
For instance, let us take the first use case –
The contract type (say Fixed bid or Time & material) is the outcome being analyzed, based on the effect of the following factors:
- Customer’s country
- Customer firm’s ownership (say Public or Private or Self-funded)
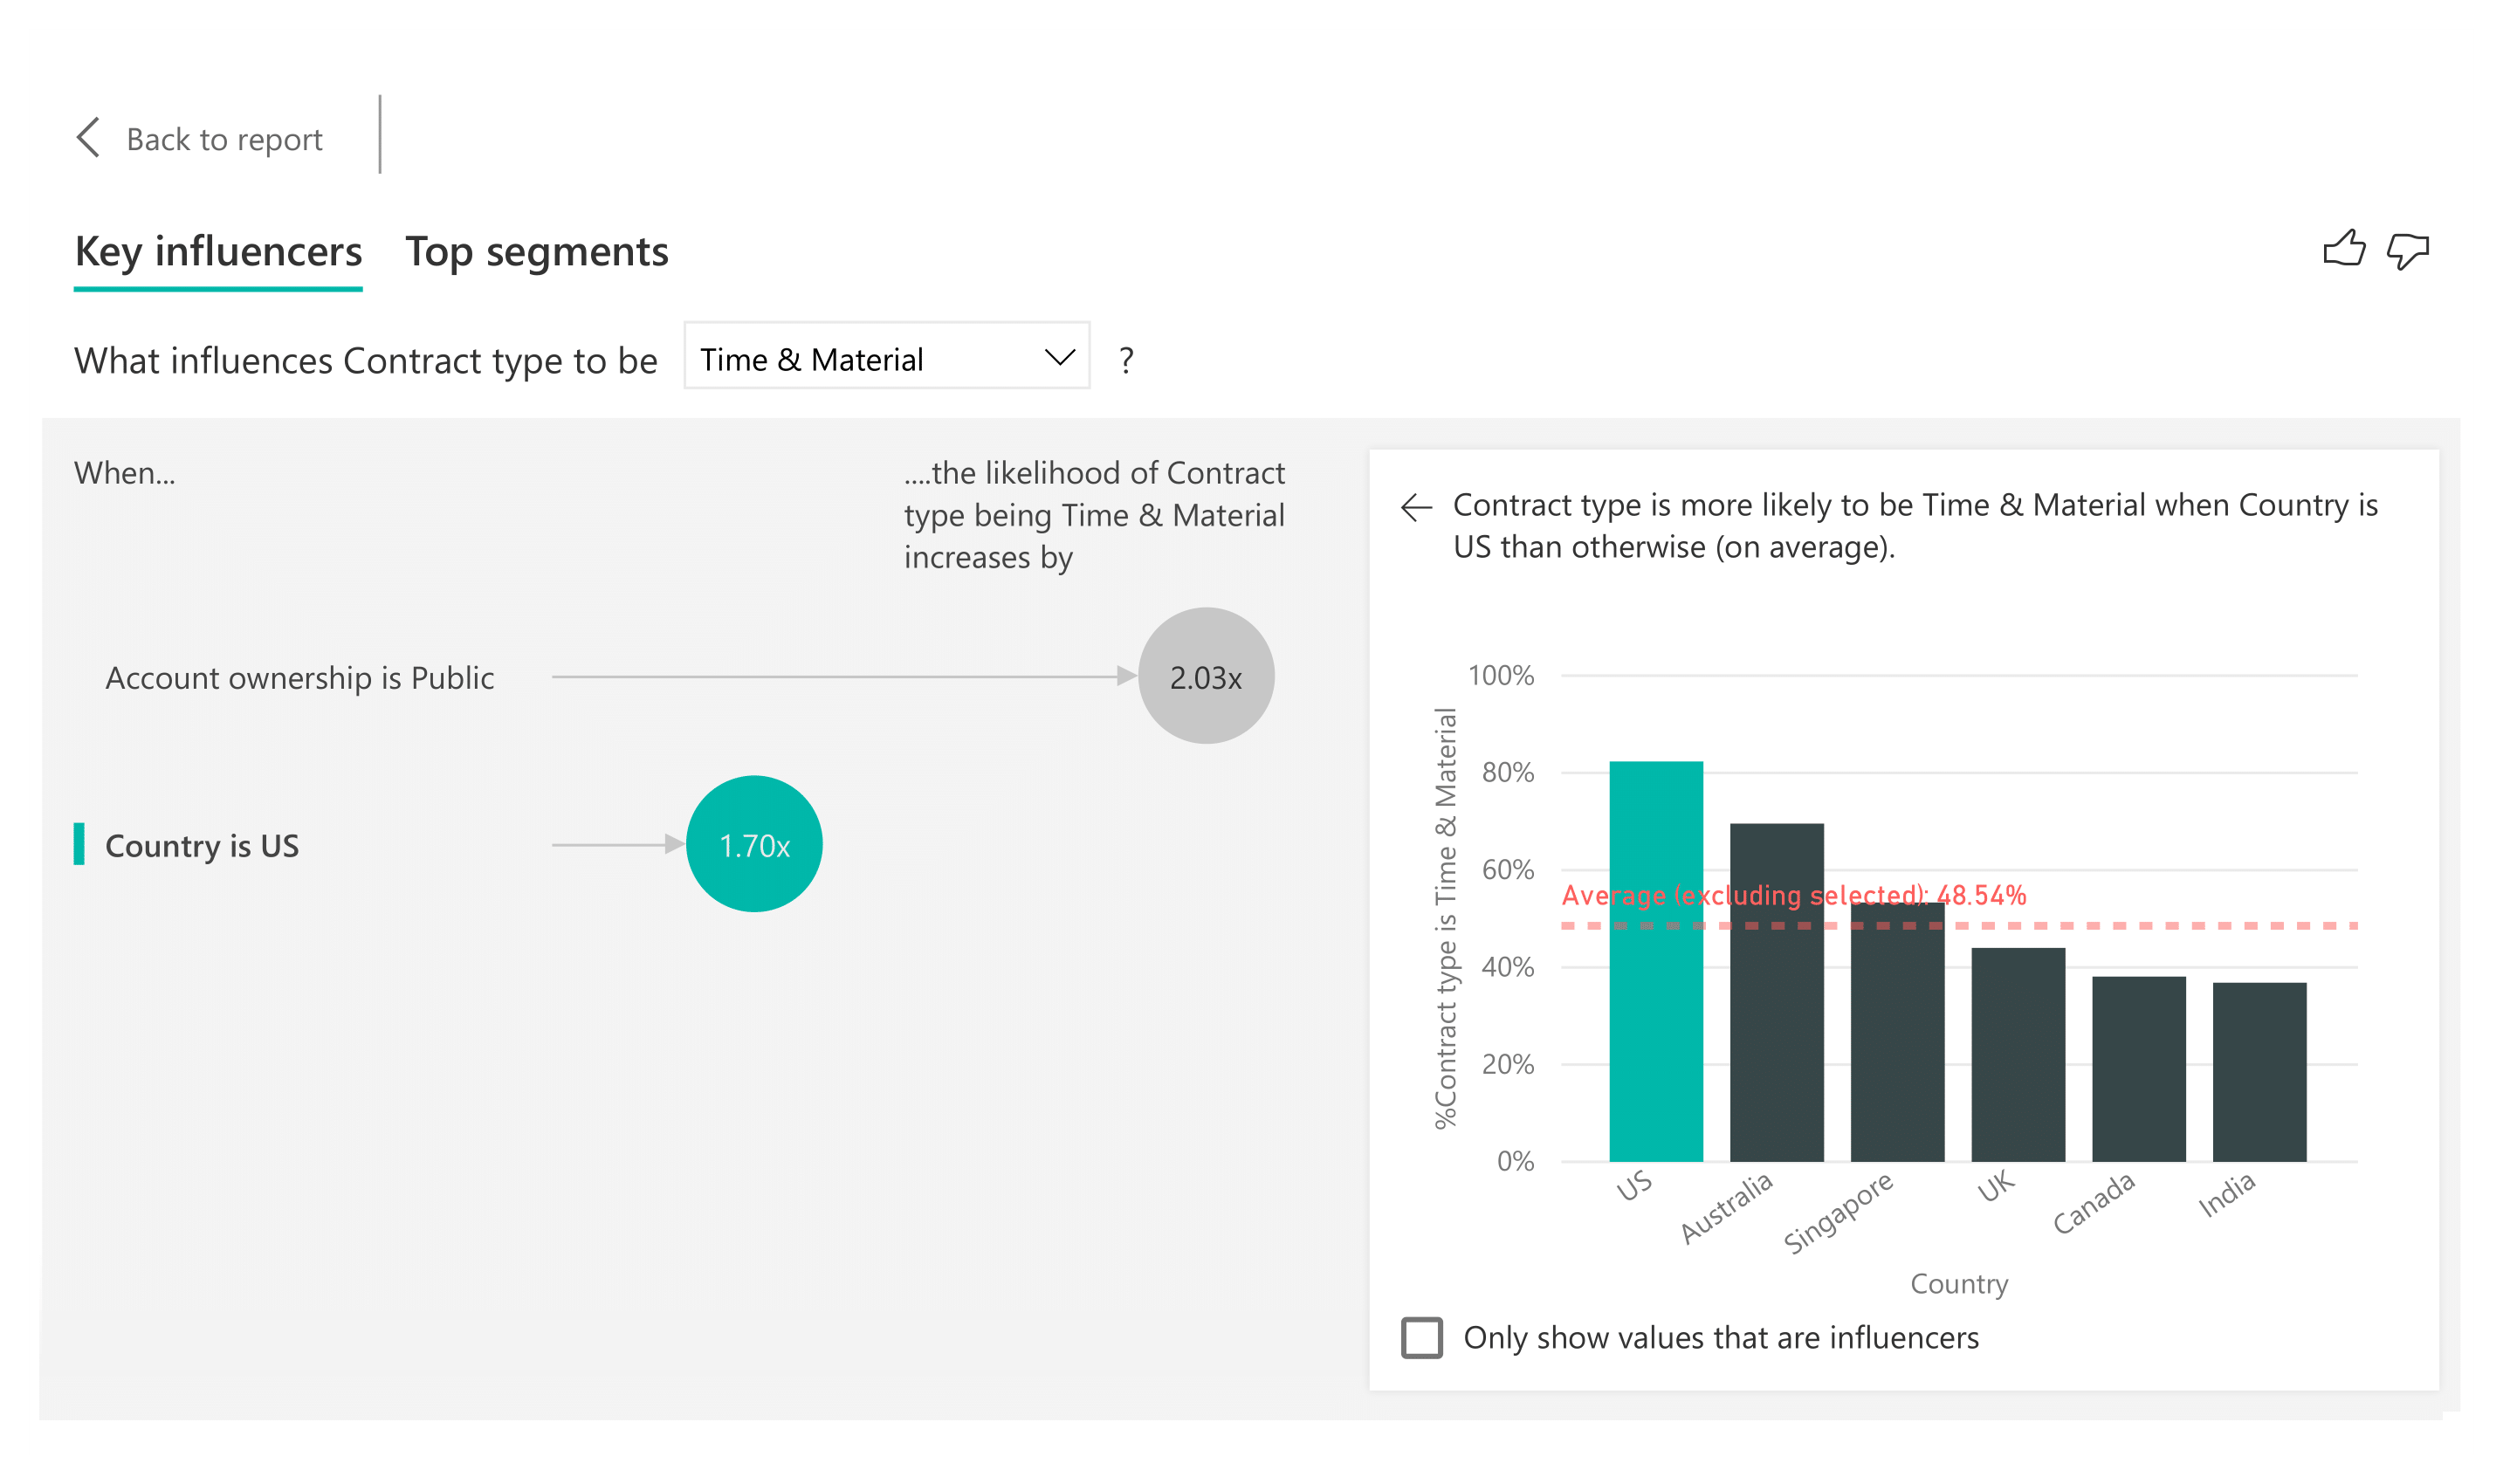
In the above visual, one can determine the answer to the question – What influences Contract type to be Time & Material?
The answers to this question are found to be:
- When Account Ownership is Public, the likelihood of contract being Time & Material increases by 2.03x
- When Country is US, the likelihood of contract being Time & Material increases by 1.7x
Now one may get the question – What are these values 2.03x and 1.7x?
The answer is given by the chart in the right part of the visual. The green colored bar indicates the key influencer, while the black bars indicate the rest of the potential influencers.
To explain in more detail, let’s take the 1.7x value for instance:
Please take a look at the following table, showing the Country-wise contract type breakup.
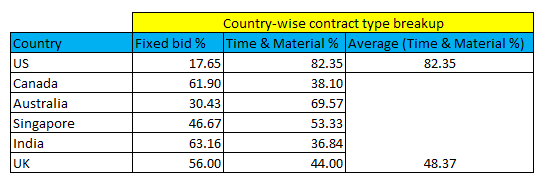
The columns in the table are self-explanatory. The average (Time & Material% – the outcome being analysed) for the rest of the countries except US is 48.37%. When comparing the Time & Material% of US – 82.3 with this average of the other countries (the potential influencers) , the resulting value is 1.7.
In other words, when the country is US, the likelihood of the contract type being Time & Material increases by 1.7x in the whole data set.
There is another interesting part of the key influencer visuals, which is the Top segments (a tab at the top of the visual). This feature scrutinizes the data set more deeper at a single click and uncovers valuable insights on segments (or combination of entries in multiple data points) that significantly affects the outcome being analysed.
For ex, refer the below image in the same Time & Material case:
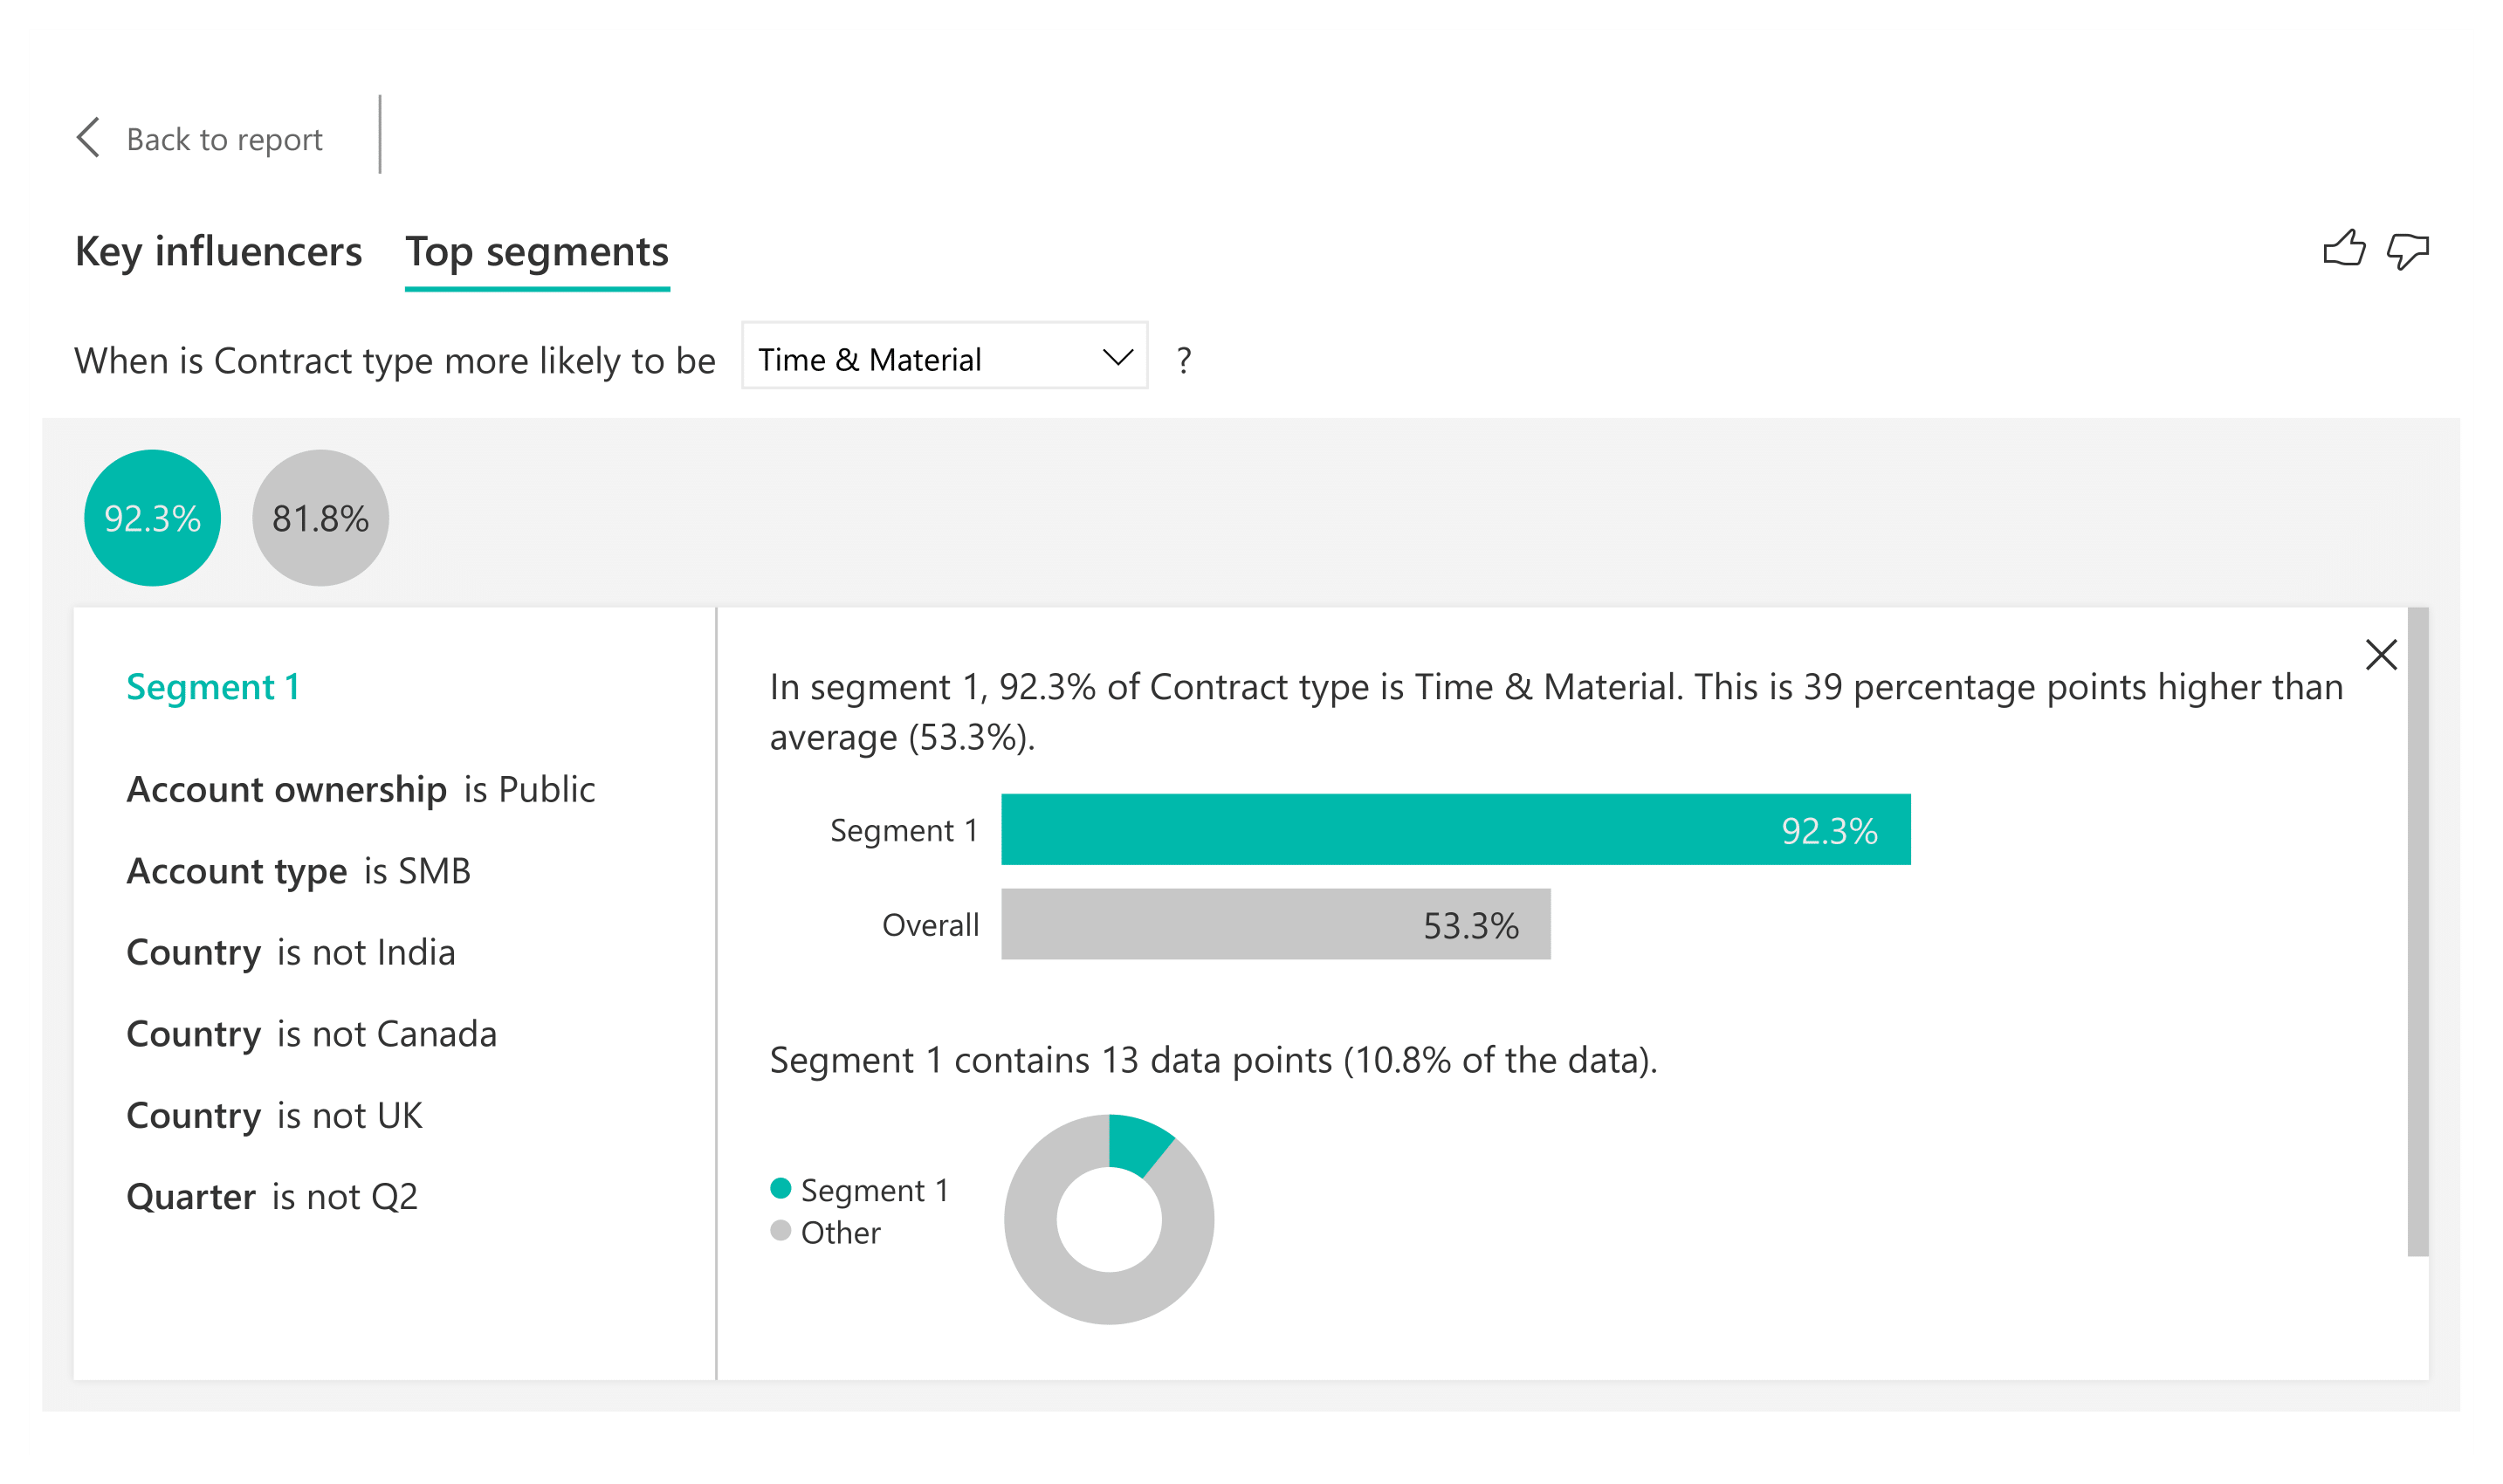
The segment identified in the above visual is as follows:
Account Ownership is Public and
Account type is SMB and
Country is not India and
Country is not Canada and
Country is not UK and
Quarter is not Q2
In the Deals data, 92.3% of the times the contract type is Time & Material when the above condition is met.
The combination of data for which the Time & Material contract type is the most expected outcome is shown in the left, while the right part of the visual shows a comparison between the
- % of Time & Material based contracts in the entire dataset and
- % of Time & Material based contracts within the identified segment
These insights can also be scrutinized much deeper by clicking the “Learn more about this segment”.
Overall, this visual enables the sales team to choose the appropriate contract type, in order to win deals based on their sales history in the past.
The Key Influencer visual is a great option to uncover insights from perspectives, which otherwise would have been harder to think of!
However, it has its own limitations –
- This visual is not suitable for an evenly distributed data set.
- The data points being analyzed should be of categorical data type.
- This visual cannot be published online, and hence collaborative usage and sharing is not possible as of now. Hopefully, this will be addressed in one of the future updates.
Combo chart
This chart compares two parameters of different scales plotted wrt a common parameter in x-axis.
Ex:
- Year in X-axis with revenue and estimated margin % in y-axis
- Sales team in X-axis with revenue and estimated margin % in y-axis
- Contract type in X-axis with revenue and estimated margin % in y-axis
- Brand name in X-axis with number of units sold and return rate in y-axis
- Month in X-axis with number of new free trials and churn rate in y-axis
As usual, the last 2 examples are only for the reader’s understanding, and not covered in the scope of the Deals data.
Let us take the first use case for instance – Year in X-axis with revenue and estimated margin % in y-axis
Please refer to the chart below:
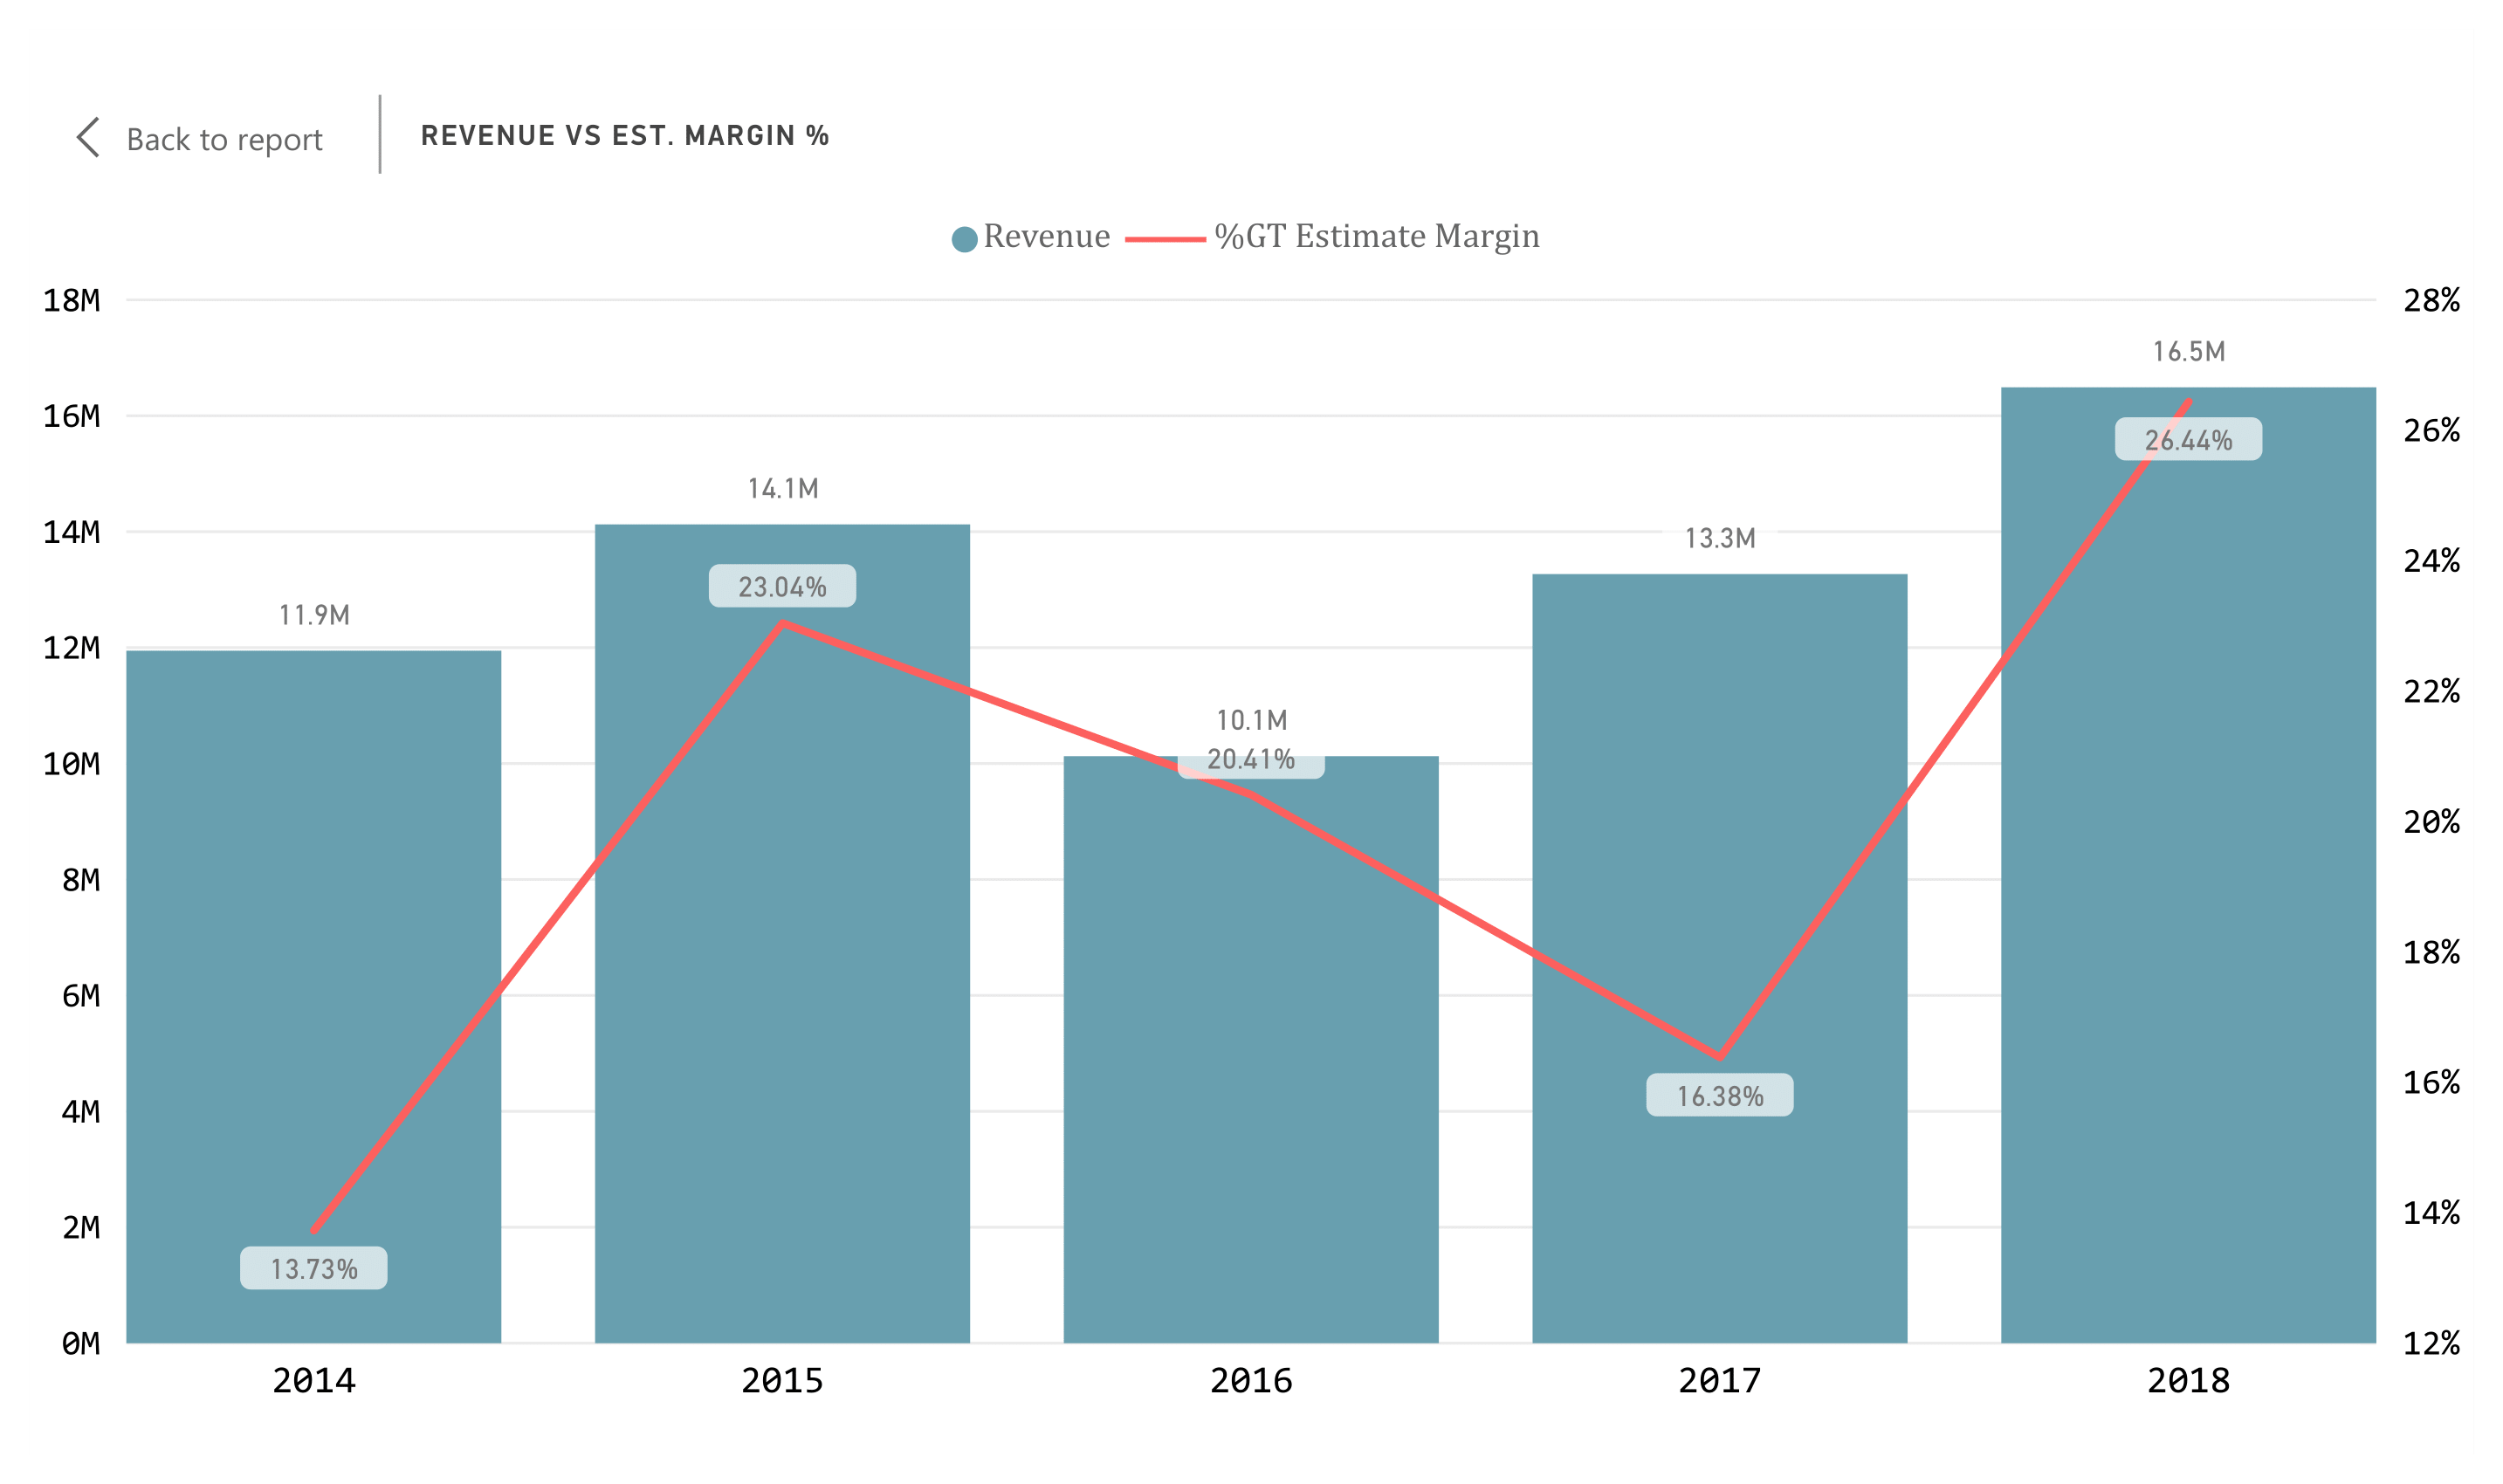
Here, the revenue is represented by the bars while the estimated revenue % is represented by the line. The scale for the line is on the right, while the revenue is on the left and the year in the X-axis is common for both parameters.
Two different charts are plotted in the same visual, thereby saving time, while more importantly enabling the user to derive insights on two separate parameters much faster. These visuals have eliminated the pain of searching for comparing two separate charts manually to uncover insights.
These visuals are prone to the following limitations:
- The values in Y-axis must be numerical
- At times, the user may get confused with two different scales on Y-axis
Waterfall charts
Waterfall charts reflect the positive or negative effect of an individual component, wrt to a time based or category based data point.
Ex:
- Revenue by year with Account type breakdown
- Net revenue in the past 5 years
- Net estimated margin % in the past 5 years
- Net employee count in the last 10 years
- Income and expense breakdown
Again, the last 2 examples are provided for the reader’s understanding and is not included in the scope of the Deals Data.
Let us take the first use case for instance.
Please take a look at the waterfall visual below:
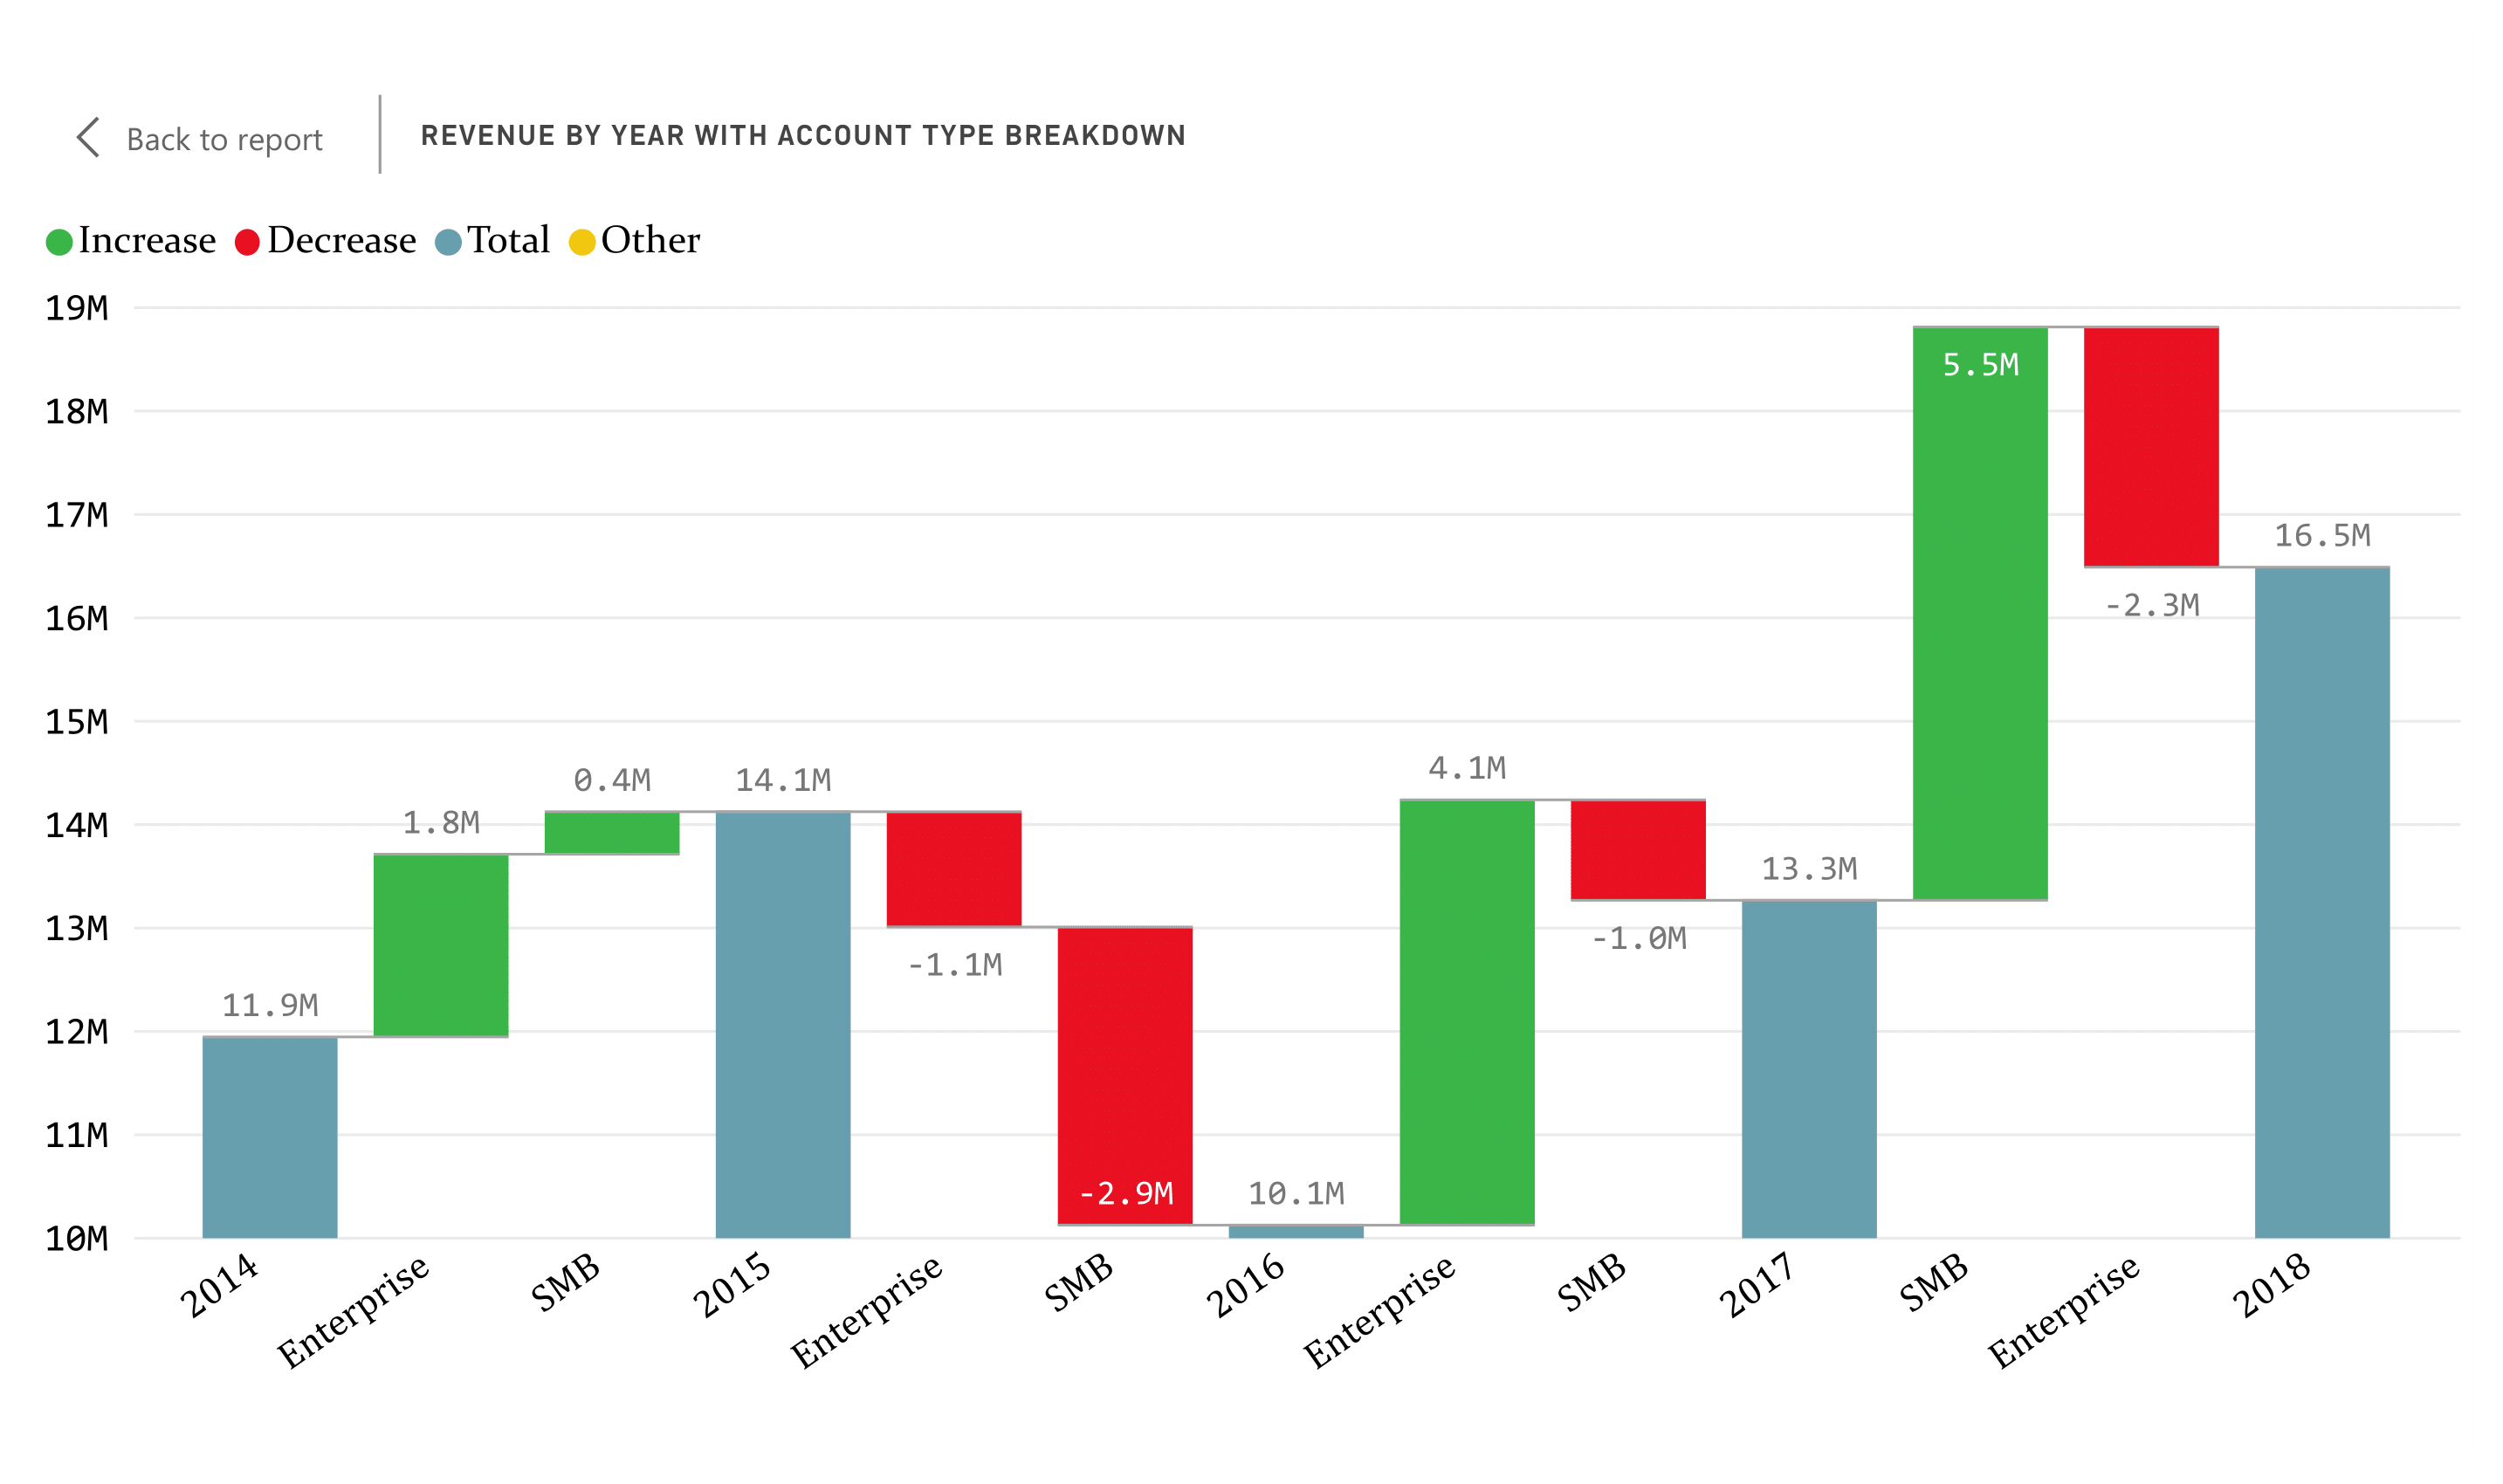
The visual uncovers the net revenue earned in comparison to the previous year. The revenue in year 2015 is worst hit, and alarming.
This insight might not have been noticed in a usual bar chart because the usual bar chart would have shown the revenue at the end of 2014 as 14.1M and at the end of 2015 as 10.1M. It would have just shown a dip of 4M in revenue from the previous year. But it wouldn’t have shown the significance of this 4M as noticed in this waterfall chart.
Limitations of waterfall chart:
- It captures the net change well, but misses to capture the effect on cumulative values.
- The users may find it quite hard in getting used to waterfall charts, as most users tend to look out for cumulative values.
With this, we come to an end for now. Found these visuals interesting?
Power BI has many more interesting visuals to explore, and we’ll keep posting updates on this page as and when we get familiarized with a new visual. Subscribe to our blogs to receive the latest updates directly in your inbox.