

April 25th, 2024
Power BI vs Tableau: Which is better?
Introduction
Business intelligence (BI) is an integral part of every organization today. Enterprises analyze and visualize data to derive meaningful insights and make informed decisions. According to Acumen Research & Consulting, the global data analytics market is expected to reach USD $329.8 billion by 2030.
Helping organizations to make the most of their data are business intelligence tools. Power BI and Tableau are two of the most popular platforms in the market.
Data analysts, data scientists, and CTOs often face a dilemma when evaluating BI tools. Through this blog, we explore the differences between Power BI and Tableau.
We will look at their features and advantages to consider when selecting the right tool for your needs.
What is Tableau?
Tableau is an interactive data visualization tool from Tableau Software built in 2003. It was acquired by Salesforce in 2019.
Simply put, Tableau enables organizations to simplify the process of data analysis. It helps users connect data and create compelling worksheets and dashboards without requiring coding or technical knowledge.
In addition, its intuitive interface and powerful visualization capabilities make Tableau a popular choice among data professionals.
With more than one million members spanning over 500 user groups, active Community Forums, and programs, Tableau has an active community to help users.
Tableau Features
Some of the key features of Tableau include:
- Vector maps: The new Tableau versions from 2019.2 V onward comes with vector-based maps that look cleaner and work smoother to explore maps and other geospatial data.
- Nested sorting: With nested sorting, users can select the field value used to determine the sort order.
- Data Highlighter: Tableau provisions highlighting specific fields or groups to explore data interactively when viewing large volumes of data.
- Workbook Formatting: Users can change fonts, theme, and other format settings at the workbook level instead of worksheet level.
- Custom Territories: Tableau helps users create custom territories by grouping locations together on a map, in addition to built in territories (example area code or country).
- Data blending: Data blending feature allows combining data from multiple sources. This is useful for analyzing related data from multiple sources in a single view.
- Data collaboration and data notifications: With Tableau, users can collaborate with team members whether data is on-premises, in cloud, or in a hybrid environment.
- Toggle view and drag-and-drop: Tableau is a user-friendly tool that enables users to filter data points with a single click and drag and drop fields to visualize data.
- Dashboard commenting: Users can add comments to Tableau dashboards in real time, improving collaboration and performance.
Which Companies Use Tableau?
- UN World Food Programme
- Wipro
- Red Hat
- GoDaddy
- Hitachi
- Pfizer
- Lenovo
- Lufthansa
- Nissan
- Henkel
- Honeywell
- Chipotle
- Verizon
Pros of Tableau
- Great performance
- Handles a large number of visual objects
- Ability to blend diverse data sets
- Easy to learn and use
- Centralized data repository
- Mobile-friendly
- Extensive official resources available for knowledge and training
Cons of Tableau
- Requires IT expertise for certain configurations
- No automatic refreshing of reports
- Poor versioning
- High-Cost
What is Power BI?
Power BI is a business intelligence and data visualization tool by Microsoft. The solution was made publicly available in 2015. Power BI is a newer technology compared to Tableau, yet a strong competitor in the market.
The data visualization tool empowers users to extract data from a variety of sources, such as Excel, images, tables, etc. Through an intuitive interface, even non-technical users can create insightful reports and dashboards.
Power BI can be easily integrated with other Microsoft products such as Excel and SharePoint and improve business performance.
Power BI Features
Filtration: In the Power Query, users can easily apply parameters for filtering datasets into smaller parts. They can filter data at multiple levels, including page, report, and visual filters.
Refresh: Power BI provides auto-refresh and manual refresh options to show latest, real-time data in reports. Users can define automatic refresh using ‘Scheduled Automatic Refresh’ for datasets.
DAX: Dax functions (Data Analysis Expressions) is a language in Power BI. These functions are essentially predefined codes that can perform analytics on data. For instance, create a custom table or column. Power BI offers over 200 DAX functions in its function library.
Natural-language query: Power BI provides a unique feature named ‘Q&A’ where users can ask questions in natural language. This AI-based tool ensures that users can interact with simple language and receive related visuals for the question. For example, what are my quarterly sales?
More Power BI Features: Enhanced User Experience and Reporting
Navigation pane: Power BI ensures a great user experience through its navigation pane feature. It has options for datasets, dashboards, and reports which can be used to navigate through dashboard and reports created.
Ad Hoc reporting and analysis: Ad hoc reporting helps to generate on-time reports with real-time data from various sources. This provides data-driven answers for business queries, ensuring faster decision making.
Online Analytical Processing (OLAP): Integrating OLAP with Power BI enables users to have multi-dimensional layers of data corresponding to different segments of information and have a holistic view of data.
Trend indicators: The trend indicators feature as part of KPIs (Key Performance Indicators) in Power BI help users to analyze changes, growth, and downfall in the business/market information.
Real-time dashboards: Power BI ensures that any dashboard created by the users can display and update real-time data. A real-time dashboard will automatically update as new data appears in the dataset.
Content Packs: Power BI offers a collection of dashboards, datasets, and reports in ‘Content Packs’ to use and share these elements without having to share underlying reports.
Which Companies Use Power BI?
- Heathrow
- Hewlett Packard
- Adobe
- Conde Nast
- EY
- Rolls Royce
- Metro Bank
- Aston Martin
- Kraft Heinz
- GE Healthcare
- Rockwell Automation
Pros of Power BI
- Easy to use
- Easy collaboration and sharing of reports
- 360-degree view of data in interactive dashboards
- Constant updates with new features
- Variety of data source connections
- Ability to create custom visualizations
- Active user community
Cons of Power BI
- Rigid formulas; uses DAX as the language for calculations
- Data handling limitations in free versions
- Limited configuration options
Tableau vs Power BI: All Differences in Detail
1. Data Visualization
Tableau is known for its data visualization capabilities. Users can create interactive and customized dashboards that are compatible with different devices.
Whereas Power BI has numerous data points to offer data visualization. Its easy drag-and-drop functionality is a great option for technical and non-technical users.
Power BI visualizations include Column Bar/Stacked//Cluster charts, Area charts, Line charts, Ribbon Chart, Funnel charts, etc. In case of Tableau, visualizations range from simple charts such as a Bar Chart or Pie Chart to complex ones like Bullet Chart, Gantt Chart, and Boxplot.
Tableau also has a lot of pre-installed information on geographical data such as Administrative Boundaries, Postal Codes, Cities, etc. This allows users to make detailed maps using Tableau.
It has various kinds of maps, including Flow map, Heat map, Choropleth maps, Point distribution map.
2. Products
Power BI and Tableau have launched various products for data analytics and the business intelligence market. Here are the different types of products and services for Power BI and Tableau:
Power BI’s Products And Services
Power BI is a part of the Microsoft Business Intelligence MSBI Suite.
It offers a wide range of products and services:
- Power BI Desktop: A free visualization and reporting tool.
- Power BI Service: Cloud-based service to publish and share reports and dashboards. It includes Free, Pro, and Premium license versions.
- Power BI Pro: A self-service Business Intelligence tool in the cloud.
- Power BI Premium: Cloud-based advanced analytics and data visualization service with advanced AI capabilities.
- Power BI Mobile: An app that lets you monitor and access Power BI dashboards anytime, anywhere.
- Power BI Report Server: An On-premise enterprise reporting server. It is available in two licenses: Power BI Premium and SQL Server Enterprise Edition
Tableau’s Products And Services:
- Tableau Server: An enterprise-level online platform to manage data and data sources.
- Tableau Public: A free platform to create and publicly share data reports and visualizations.
- Tableau Online/Cloud: A fully-hosted, cloud-based, analytics platform that makes sharing and collaboration easy.
- Tableau Desktop: A self-service business analytics and data visualization tool.
- Tableau Prep: A visual tool designed to make preparing your data easy and intuitive.
- Tableau Reader: A free desktop application to view and interact with data visualizations.
- Tableau Mobile: An app for Tableau Online and Tableau Server, giving you access to your Tableau site on the go.
3. Cost
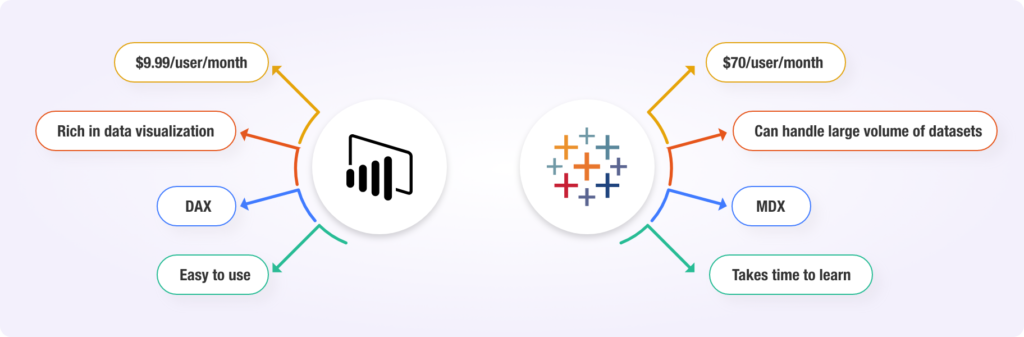
Which is more cost-effective, Power BI or Tableau? When compared to Power BI, Tableau is expensive. The yearly subscription for Tableau’s Pro version is 10 times more than the Power BI Pro version.
So, for organizations with budget constraints or already using Microsoft suite, Power BI can be a better option.
In short, for startups and small businesses, starting with Power BI allows you to keep initial costs low, with the flexibility to upgrade to Tableau as your business needs expand and evolve.
| Power BI Pro | Tableau Creator |
| Starts at $9.99 per month | $70 per user/month |
| Power Bi Premium : – Per User: $20/user/month – Per Capacity: $4995/capacity/month | Tableau Explorer $35 user/month |
Power BI Cost
Note: Users don’t necessarily need a subscription to Office365 to use Power BI.
Power BI Pro, a self-service BI in the cloud costs $10 per user/month.
Power BI Premium provides advanced analytics, on-premises and cloud reporting.
Power BI Premium is licensed on 2 plans:
- Per User: $20/user/month
- Per Capacity: $4995/capacity/month
Power BI is highly affordable for companies that already use Microsoft software in their ecosystem.
Tableau Cost
Compared to Power BI, Tableau has a completely different pricing system.
The pricing structure is divided between individuals, teams, and embedded analytics.
For teams, the pricing is further divided into Tableau Creator, Tableau Explorer, and Tableau Viewer.
Tableau Creator costs $70 per month. Also, it provides access to Tableau Desktop and Tableau Prep Builder, and offers a Creator license of Tableau Server or Tableau Online.
Tableau Explorer provides one license for Tableau Server at $35 per month and provides a minimum of 5 explorers. Tableau Viewer is priced at $12 per month with minimum 100 viewers.
4. Security
Power BI uses Azure BLOB storage and Azure SQL database for storing and managing data storage security. It also provides row-level security (RLS) for role-based data access.
Also, Power BI uses Azure Active Directory for user authentication and enforces Transport Layer Security (TLS) for network communication.
Users can configure authentication, data security, and network security in Tableau.
Tableau has the following pre-set user roles:
- Viewer
- Interactor
- Editor
These roles are available for the publisher to set up access permissions.
Tableau also provides RLS options for admins. It recommends SSL and HTTPS configurations for network communication between client-Tableau Server and Tableau Server-database.
5. Dashboards – Ease of Use
Power BI is equipped with modern features to help convert raw data into interactive and visually appealing dashboards. In addition, it is designed to let users visualize data insights even without prior knowledge or experience.
Besides, creating dashboards is simple, using Power BI’s tiles, or visible metrics, which link directly to reports and datasets.
Power BI Dashboard:
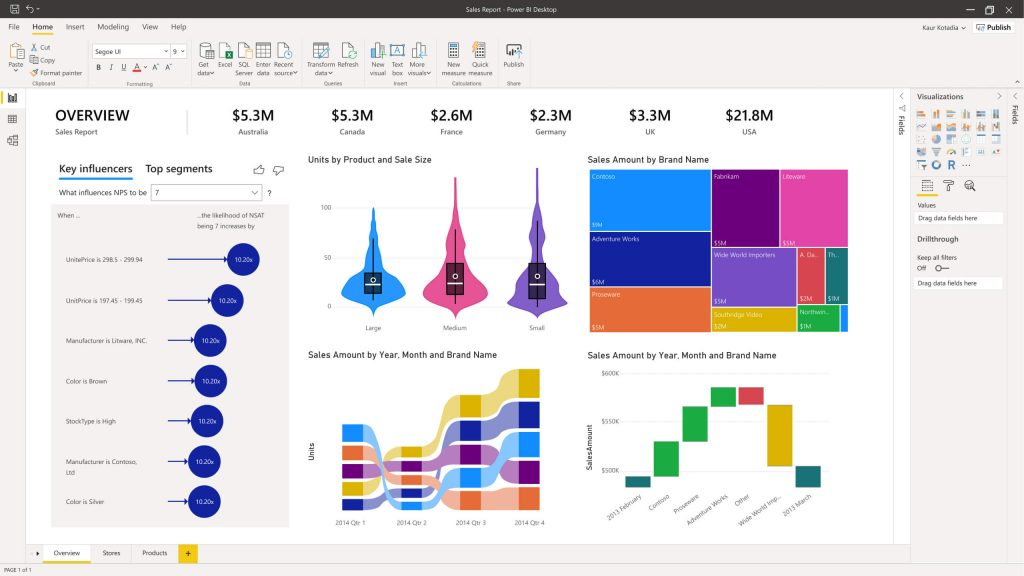
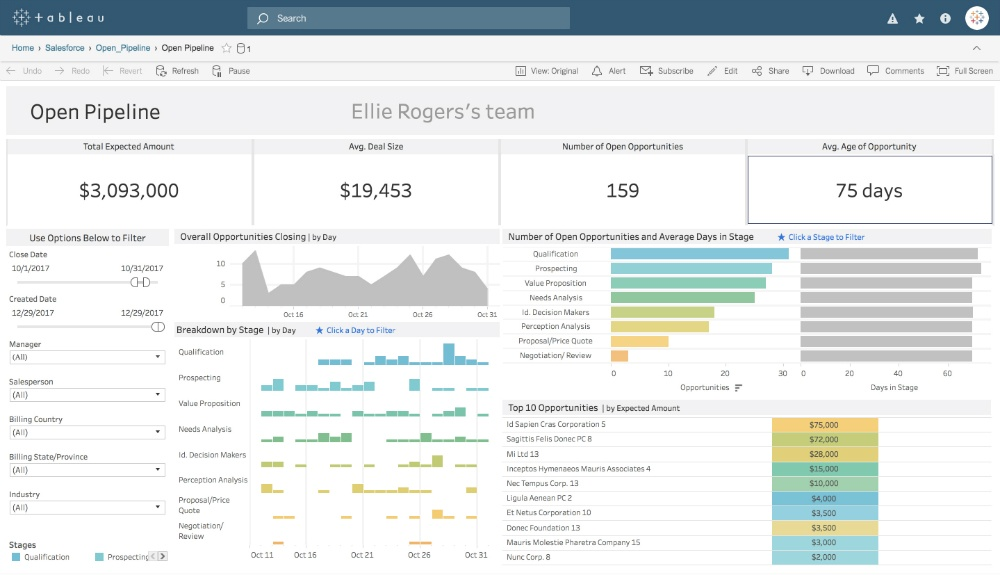
Tableau features are as powerful as Power BI. However, compared to Power BI, many of the features are hidden behind menus.
Tableau is known for its visually stunning dashboards that are easy to create using drag and drop.
Tableau Dashboard:
6. Data Sources
Companies use different means to store their data. Different departments might store data across BigQuery, Google Cloud Bucket, Amazon Redshift, and even CSV files.
When choosing a BI platform, it’s important to select one that supports multiple data sources. Both Tableau and Power BI support multiple data lakes and storage.
Below, you will find a table that highlights all popular data sources that Power BI and Tableau supports.
Note: Power BI, connection to some of the data sources require Data Gateways.
| Data Source | Power BI | Tableau |
| Adobe Analytics | Yes | No |
| Amazon Redshift | Yes | Yes |
| Alibaba Data Lake and Analytics | No | Yes |
| Excel | Yes | Yes |
| Yes | No | |
| Google Analytics | Yes | Yes |
| Google Ads | No | Yes |
| BigQuery | Yes | Yes |
| Hadoop | Yes | Yes |
| IBM DB2 | Yes | Yes |
| MySQL | Yes | Yes |
| Oracle | Yes | Yes |
| PostgreSQL | Yes | Yes |
| R Script | Yes | Yes |
| Python Script | Yes | Yes |
| SalesForce Report | Yes | Yes |
| Spark | Yes | Yes |
| SQL Server | Yes | Yes |
| JSON | Yes | Yes |
| Azure SQL | Yes | Yes |
| Text File | Yes | Yes |
Tableau vs Power BI Comparison
| Power BI | Tableau | |
| Parent Company | Microsoft | Salesforce |
| Establishment Year | 2013 | 2003 |
| Pricing | Cost-effective. The Pro plan starts at $9.99 per month per user. | Costly. The basic Creator bundle starts at $70 per month per user. |
| Licensing | No license keys required. | License keys are required. |
| Usability | Small, medium, and large enterprises | Large enterprises |
| Performance | Rich in data visualization, integration, and manipulation. | Hypothetical visualization, ad-hoc analysis, capable to handle a huge volume of datasets |
| Security | Row-level security and role restriction. | Offers row-level security and set up filters. |
| Learning Curve | Power BI can be utilized by both experts and beginners. | Tableau is best suited for seasoned data analysts. |
| Underlying language | Power BI uses DAX (Data Analysis Expression) for calculated columns and measures. It affects speed and reporting capabilities. | Tableau employs MDX (Multidimensional Expressions). for dimensions and measures. |
| Supported language | R language-based visualizations are supported. | Fully integrated support for R and Python is provided. |
| Deployment | – On Cloud – On-premise – Windows | – On Cloud – On-premise – On Linux – On Mac – On Windows |
| Supports SQL | Yes | Yes |
| Performance | It can handle a limited volume of data. | It can handle a huge volume of data with better performance. |
| Data Capacity | Power BI can handle only 10 GB of data. Anything more than that requires cloud services like Azure. | Tableau can handle billions of data without any requirement for cloud services. |
| Easy to use | Easier to learn and use. | Takes time and expertise to master. |
What are the advantages of Power BI over Tableau?
Real-time streaming datasets can be created directly in Power BI. In addition, Power BI is also better at handling complex relationships between tables and data sources.
Power BI is faster and gives quick insights. It is user-friendly and comparatively cost-efficient than Tableau.
Power BI also brings the power of transformations to the table. It can even include machine learning algorithms through clustering as you load your data into your analysis.
What are the advantages of Tableau over Power BI?
Power BI tends to drag slowly while handling bulk data. Tableau can handle large volumes of data quickly. It is faster and provides extensive features for visualizing large data sets.
Tableau doesn’t limit the number of data points in visualization. Nor does it enforces row or size limitations. It provides a 360-degree view of your data.
Key differences between Power BI vs Tableau | Which one is better?
Well, it depends on your requirements.
Both have their own set of features and strengths in terms of powerful data analytics and data visualization.
If you’re a beginner, Power BI is the more suitable choice as it is more user-friendly. Any non-technical user without prior coding knowledge can create interactive dashboards.
Power BI also has the ability to work with multiple data points and is suitable for small teams with limited resources. Its pricing plans are also more affordable than Tableau.
Tableau is capable of handling large datasets. It is best known for its visually attractive data visualizations and is suitable for medium and large enterprises.
Tableau is preferred when organizations have a huge data repository, mostly including medium and large enterprises and and enables users to customize dashboards specifically for devices. Tableau also has an extensive community of users for support.
You can also watch our video explaining the key differences of Power BI and Tableau.
Conclusion
In short, both Tableau and Power BI are two powerful tools for business intelligence and data visualization. While both of them have their strengths, the choice ultimately comes down to your requirements and budget.
If you’re an Oracle user seeking to connect Power BI or Tableau to your Oracle data, we have an excellent option.
BI Connector is a one-of-its-kind solution that helps Oracle users bring their OBIEE, OTBI, OAC, OAS, and Oracle Fusion Analytics (HCM, SCM, ERP, and CX) data to Power BI and Tableau. The user-friendly solution helps you start visualizing data in a few minutes.
We offer a free download and a 30-day free trial plan for users. To know more, click the banner below.