

July 28th, 2023
5 Quick Ways to Export Data from Tableau View onto Excel
Tableau is a popular tool that offers a wide array of beautiful and interactive visualizations. Users often come across scenarios where they need to export data from Tableau to Excel.
Tableau allows users to choose between exporting the filtered data underlying a visualization or the whole dataset from a data source. It also provides the flexibility to export the data to Excel in multiple formats.
In this blog post, we’ll cover 5 quick ways to export data from a Tableau view onto Excel.
Exporting the data underlying your Visual
Tableau provides a built-in functionality to export data. A Visual can be exported to Excel in the following ways:
- Crosstab
- Data
- Image
If you have several visuals on your dashboard, first select the visual you would like to export, then follow one of the options below.
📌 [Tableau Hacks] Saving Dashboard Space With Hidden Containers >>
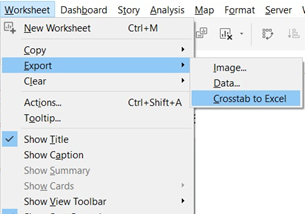
1. Export the visualization as a Crosstab
There are two methods to export as a crosstab:
a. Use the Menu Option Worksheet, Export and Crosstab to Excel.
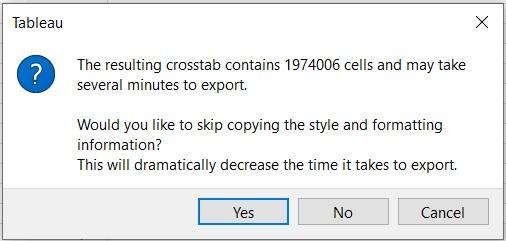
If there is a significant amount of data to export this can take a long time to export as Tableau applies formatting to this exported data.
You may be prompted with a warning message and be given the option to export without formatting. This can reduce the amount of time it takes to export.
b. Alternatively use the Menu Option Worksheet, Copy and Crosstab. Then open Excel and paste the crosstab.
This second method is a much faster way to export crosstab data to Excel. However, numbers are converted to text fields so these will need to be converted back to numeric values before further analysis can be undertaken in Excel.
📌 Supercharge OBIEE With Tableau [eBook] >>
In addition, if you export numeric fields, the formatting applied in the visual is applied in your pasted data. For example, if decimal places are not visible in the visual then the numeric figures will be rounded to zero decimal places in your pasted excel copy of the data.
2. Export the visualization as data
a. Use the Menu Option Worksheet, Copy and Data. Then open Excel and paste the data.
When you export data or a crosstab from Tableau to Excel, only the filtered data within the visual is exported (i.e. only the data included in the Columns, Rows and Colors shelves will be included in the data or crosstab). Any filters on the filters shelf will need to be added to the Tooltips on the Marks Card for the information relevant to the filter to be visible in the data or crosstab.
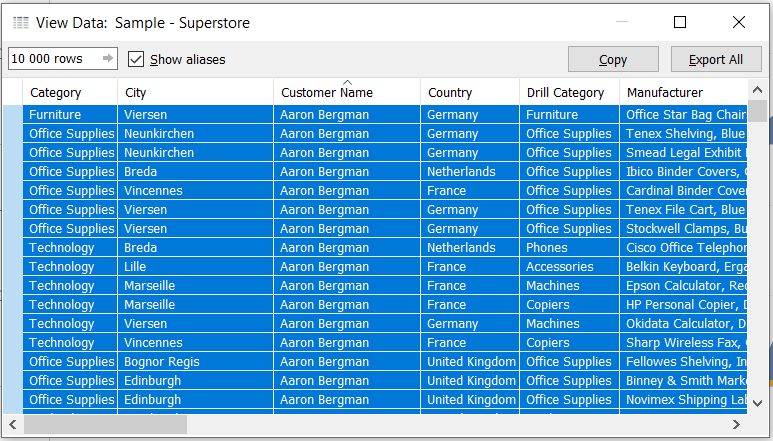
b. You can also export the filtered data by right clicking on the visual and selecting View Data. The summary view will contain the same data as that accessed using WorksheetCopy and Data.
Within this data pane you can use the Full Data tab selection on the bottom to get the full view of the data underlying the visual. In order to select this full version of the data, click just to the left of the top header. The selected data will be highlighted in blue.
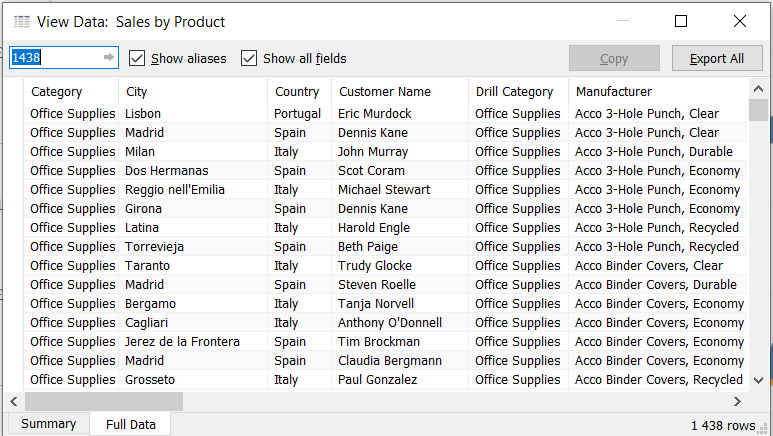
Use the copy button to copy to the clipboard and then paste in Excel.
📌 5 Must-haves of Tableau OBIEE Connectors [Infographic] >>
3. Export the visualization as an image
You may also want to export an image from Tableau, and this can be done as follows:
Use the Menu Option Worksheet, Copy and Image. Select the layout to apply to your image. You have the option of showing or hiding the Title, View, Caption and Legend. There’s also an option to have legends displayed to the right or bottom of the image.

Then open Excel and paste the image.
With this we have seen 3 ways to export the underlying data to Excel from a Tableau visualization.
Now let’s take a look at the two more ways with which the whole dataset of a data source can be exported to Excel.
📌 Tableau Row Level Security (RLS) Setup – Simplified Guide >>
Export the Data from the Underlying Data Source
An unfiltered view of the data can be extracted from the underlying data source either through the Dimensions pane or from the Data Source View.
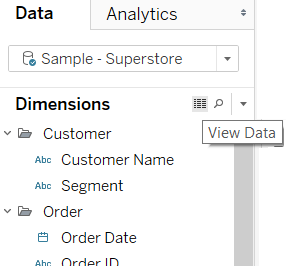
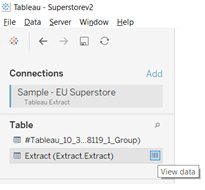
4. Extract using the Dimensions pane
Select the View Data icon in the Dimensions pane. A data pane will popup with the data underlying the data source.
You can use this data pane to change the order of your columns by dragging and dropping the columns. You can also change the number of rows displayed in the rows box at the top.
📌 [Tableau Hacks] How to Improve Interactiveness With Parameter Actions? >>
Once you have finalized your view, select all the rows by right-clicking on the top left of the header. The selected rows will get highlighted in blue. Use the copy button to copy to the clipboard and then paste in Excel.
5. Extract using the Data Source pane
Navigate to the data source and select the View Data icon for the data source from which you want to extract the data.
This will bring up the View Data pane.
As in the previous example use the data pane to finalize the order of columns and number of rows you would like to export. Select the rows and use the copy button to copy to the clipboard. Then paste it in Excel.
Now that we’ve seen 5 ways to export data from Tableau view to Spreadsheets, you may also look for ways to export several visuals within your report to Excel in one shot.
Let’s also take a brief look at how to use the Export All Extension for Tableau Server.
Export All Extension for Tableau Server
If you have several visuals within your report that need to be saved to Excel, Tableau Server has an extension that makes this process simpler.
Once you have installed the Tableau extension the export option is activated by placing a button on your dashboard. This button will allow you to select and export multiple sheets with a single click into an Excel workbook. The extension is available for Tableau version 2018.2 or later.
📌 Tableau Certified Connector for OBIEE, OAC & OAS – Try it Now >>
The extension can be found in the extensions gallery at the following link https://extensiongallery.tableau.com/products/25
Hopefully, this feature will soon be made available on the Tableau desktop as well!
Limitations of Exporting data from Tableau to Excel
We have discussed different ways you can export data from Tableau to Excel. However it is also important to know the limitations of these processes. First, the entire process is lengthy and complex. You should have a sound knowledge of Tableau and its functions. Also, you can not export real-time data from Tableau into Excel. Any changes made will not be reflected in the sheets. You will have to export data into Excel again.
Conclusion
In this blog, we discussed the various methods to export data from Tableau View to Excel.
To export data from underlying visual, Tableau offers three ways:
- Crosstab
- Data
- Image
To export data from underlying source, users can either:
- Extract using Dimensions pane
- Extract using Data source pane
Tableau Server also provides an extension for exporting several visuals within your report to Excel.
Are you an Oracle user looking to bring OBIEE, OTBI, OAC, and OAS data to Tableau? BI Connector is the right solution for you.
BI Connector is a simple, efficient tool that helps users connect Tableau to Oracle BI data and create interactive dashboards. We also enable users to connect Power BI/Tableau with Oracle Fusion Analytics data from HCM, SCM, ERP, and CX.
To know more, check out the banner below.