The Fail-safe Method to Improve Your
OBIEE Data Literacy
Organizations using Oracle Business Intelligence Enterprise Edition (OBIEE) are connecting data visualization tools (such as Tableau, Power BI) to OBIEE for simplifying data visualization.
Some organizations, despite moving to OAC/OAS, still prefer connecting Power BI to OAC or OAS as well, as many users prefer sticking to Power BI.
But the question is – Will just connecting Power BI to OBIEE (or OAC/OAS) solve the analytics problems?
The answer is – No, absolutely not!
The reason is the absence of a strong OBIEE data literacy among the end-users. Though the IT teams are clear about how the OBIEE data is organized, the end-users find it difficult to understand the data.
OBIEE Data Literacy
Most, if not all, end-users of OBIEE lack clarity in:
- The fact and dimension tables in a subject area, and their relationships
- Identifying the tables used in the columns of the OBIEE reports
- The data formats in tables/reports
- How the report folders are organized
Without a clear understanding of the data, there’s too little or no chance to gain valuable insights out of it.
BI Connector, apart from connecting Power BI to OBIEE securely and seamlessly, can also help you develop your OBIEE data literacy.
Let’s see how!
Steps to improve your OBIEE data literacy
Assume that you’re an end-user interested in analyzing data from specific OBIEE reports. Here’s what you should do to get familiar with your OBIEE data source!
Heads-up: If the data you want to analyze isn’t available in any OBIEE report, you should create the report in OBIEE first.
Below are the steps you need to follow to improve your OBIEE data literacy:
- Open the report in OBIEE, and follow the below steps:
- Trace the individual Subject Areas/tables used to build the report
- Understand the data formats used in the table and the report
- Identify the fact and dimension tables
- Notice the columns used to connect the fact and dimension tables
- Connect your Power BI to an OBIEE report using BI Connector, either in Import (or) Direct Query modes. Please refer the below steps:
- Create a visualization in Power BI out of the OBIEE report’s data. Check if the results tally with your OBIEE report’s data.
This way, you’ll not only improve your OBIEE data literacy in a fail-safe approach but also simplify your OBIEE data visualization through BI Connector!
Bonus Takeaway
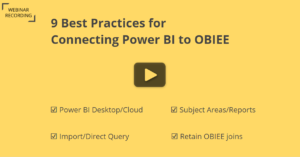
By improving your OBIEE Data Literacy, you’ve successfully learned the first of the 9 best practices for connecting Power BI to OBIEE/OAC.
