September 26th, 2021
Graph Analytics for Big Data: Everything You Need to Know
In recent years, the number of businesses using graph analytics is increasing at a steady pace.
Graph Analytics equips organizations to uncover insights from relationships between entities much faster.
Snowflake For Data Lake Analytics – Jumpstart Guide >>
The full potential of knowledge graphs is untapped yet, as it is in the growth stage of the product lifecycle.
What is Graph Database?
A Graph Database stores data as entities and relationships. It brings to mind the Entity-Relationship (ER) diagrams used in the architecture of a relational database.
How about unifying all the tables of an ER diagram, and using them directly for each record, with some notational variations?
Well, that’s pretty much what Knowledge Graphs are all about!
A graph database is simple to use and easy to query and understand.
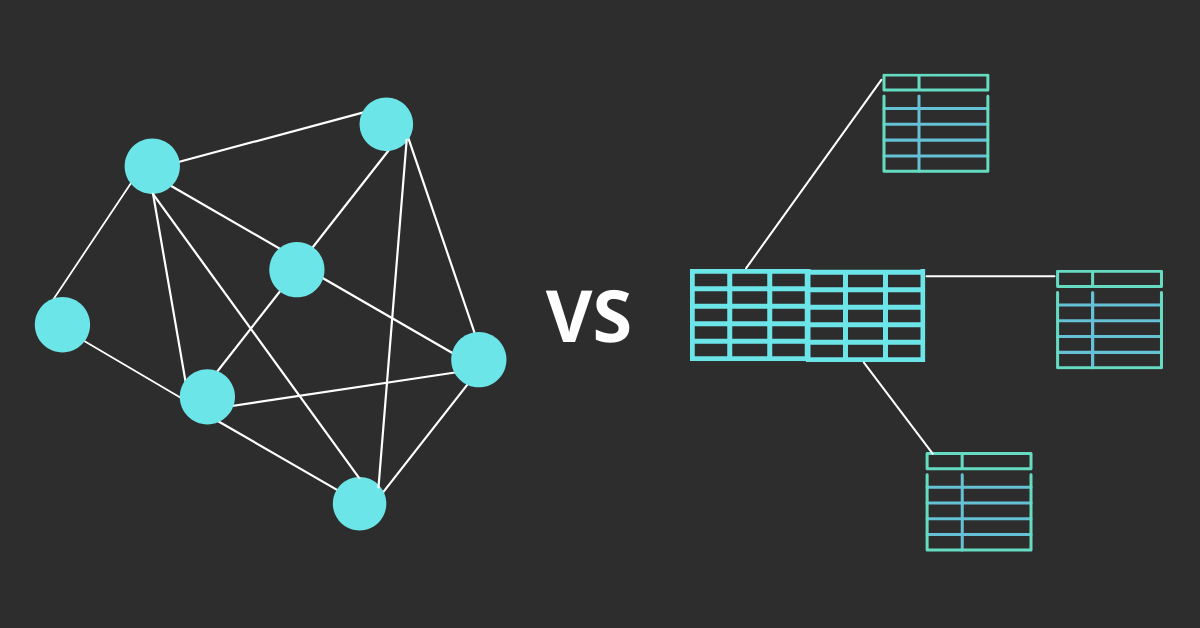
The relational database stores data in the form of tables with appropriate joins between them. But in a Graph Database, the data is stored as a graph made up of Nodes and Edges.
5 DOs and DON’Ts of Cloud Data Warehousing >>
Nodes and Edges
The Nodes are the entities, while the Edges are the relationships between them.
For example, consider the following graphs.

Graph 1 conveys that Jack is the brother of Jane. Here, Jack is the source entity, and Jane is the target entity, connected by the edge “brother of”.
You can identify the source and target entities by the direction of the arrow in the edge. The target entity is pointed by the arrow mark.
In Graph 2, we see that Jane is the sister of Jack.
Graphs 1 and 2 have unidirectional edges, which means that the source and target entities are identifiable.
In Graph 3, the relationship is bidirectional and conveys that Jack and Jane are siblings.
All the above graphs had only one edge. Now let’s see a quick example of a multi-edge graph.
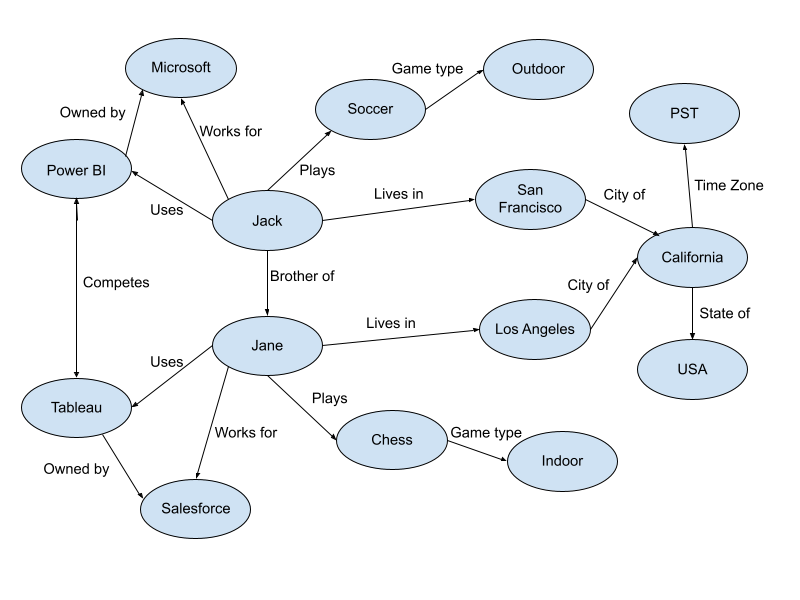
Many enterprises today use Big Data technologies to store all their data in differen formats (say files, video, audio etc) in a single place, regardless of their usage in the future.
Now imagine all your business information visualized as knowledge graphs.
You can easily uncover relationships between entities or identify a network of relationships, and tap into this information for identifying business opportunities.
Traditional Database vs Graph Database
Knowledge Graphs differs from a traditional database in the following ways:
- Data is stored as graphs in a Graph database, unlike rows and columns in a traditional database
- Graphs are Natural language friendly, represents relationships in simple English
- The query performance in a Graph database is relatively faster than in a traditional database
- Graph visuals easily unlock network/relationship insights
- Graphs are flexible to add new data attributes, which isn’t possible in a traditional database (which has a rigid schema)
For creating knowledge graphs your database must support the graph model.
You can either choose a database that exclusively supports the graph model or one that supports multiple models including graphs.
Power BI Row Level Security (RLS)- Simplified Setup Guide >>
What is Graph Analytics?
Graph Analytics refers to the analysis performed on the data stored in knowledge graph data.
It’s just like Data Management and Data Analysis. You organize the data in a Graph Database before performing the Graph Analytics.
In Graph Analytics, the queries are executed via the edges connecting the entities. The query execution on a graph database is comparatively faster than a relational database.
You can differentiate entity types like a person, city, etc, by adding colors, weightage, format data, and label them in the way you want for visualizing it.
Types of Graph Analytics
Based on your goal, graph analytics could be used in different ways. Let’s see them briefly below.
Node strength analysis
The significance of a specific node in a network of nodes is determined by node strength analysis. The higher the strength the more important the node to the network.
Edge strength analysis
As the term indicates, the edge significance analysis is all about the weightage of an edge in connecting two nodes. This analysis helps to determine the strength (strong or weak) of an edge between two nodes.
OAC vs OAS – When to Choose What? >>
Clustering
Clustering enables grouping objects based on the characteristics they exhibit. Clustering is extremely useful when you want to categorize your graph data in a customized way.
Path analysis
Path analysis involves finding out the shortest and widest path between two nodes. This kind of analysis is used in social network analysis, supply chain optimization.
Predictive graph analysis
Predictive analysis, in a graph database, is the analysis performed on past graph data, to determine the edges or nodes in the future.
Let’s see some real-world use cases to understand these better.
Graph Analytics in Action
There are several ways businesses tap into Graph Analytics to unlock hidden relationship insights.
Let’s see some of them below.
- Social network analysis
- Recommendation engines
- Compliance
- Fraud detection
- Operations optimization
- National security and defense
Social Network Analysis
Social networks, like Facebook, Linkedin, Instagram that we use in our day-to-day life, are one of the best examples of knowledge graph applications.
The influencers of a specific target audience on the social media platforms are identified easily with knowledge graphs.
Getting the word out about your offerings through influencers, called “influencer marketing” is a new normal now.
Further, companies visualize the connections and identify networks to reach an influencer or the final decision-makers. Mutual connections help a lot in Linkedin.
Finding talent is another application with social network analysis, and there’s so much more!
Power BI vs OBIEE – H2H Comparison >>
Recommendation Engines
The “You may also know” or “You may also like” recommendations in the social media platforms, and entertainment applications are examples of a graph analytics application.
With graph analytics, they identify a stream or creator that is of interest to you, and recommend content from that stream or creator on your feed.
The “You may also know” recommendations are usually backed by the school or college you studied at, or the company you worked for, or through a mutual connection.
Compliance
Implementing regulatory compliance or company-specific policies is simplified by graph analytics.
Examples include – detecting transactions involving sanctioned businesses, banned geographies, unauthorized transactions, etc.
Knowledge graphs also help in busting cyber-attack networks.
Fraud detection
The eCommerce businesses can make use of knowledge graphs for detecting and stopping orders placed from hacked accounts, false refund claims, etc.
Banks and financial institutions can quite easily tackle fraudulent insurance claims, unauthorized transactions, transactions from hacked accounts and so on.
Due to the prevailing pandemic, many banks offer the convenience to open accounts online. Banks can make use of Graph analytics to identify and stop trouble-makers from opening multiple accounts with no intention to use those accounts.
The knowledge graph applications from the fraud detection aspect are mostly reactive. But with appropriate ML and AI algorithms in place, such activities can be stopped proactively as well.
5 Quick Ways to Export Data From Tableau to Excel >>
Operations Optimization
The shortest path graph analytics is used in optimizing the operations and increasing the business efficiency while lowering costs.
The applications are plenty – like identifying the shortest route in supply chain management, building product distribution networks for different geographies, and so on.
National Security and Defense
The application of graph analytics for National security and defense is quite controversial, as it oversteps the citizens’ privacy line.
Governments analyze individual chat messages, online activities, and calls to identify and arrest the people involved in criminal activities, and also to eliminate unnecessary suspicion on innocent civilians.
From a government’s view, this helps them to strengthen the national defense by busting terrorist networks and stopping enemy attacks and crimes.
But as pointed earlier, this kind of application also points out the privacy concerns of innocent civilians.
9 Best Practices for Connecting Power BI to OBIEE/OAC >>
Conclusion
A decade ago, Graph Analytics was a grey area to many companies tapping into this technology today.
Graph Database is a solid foundation for Graph Analytics.
As Data Management continues to evolve, Graph Databases are poised to become a new normal for data analysis in the foreseeable future.
Though currently, graph databases may not be able to replace relational databases from an operational standpoint, one can expect the potential gaps to be closed in the future, to enable businesses to operate with graph databases.