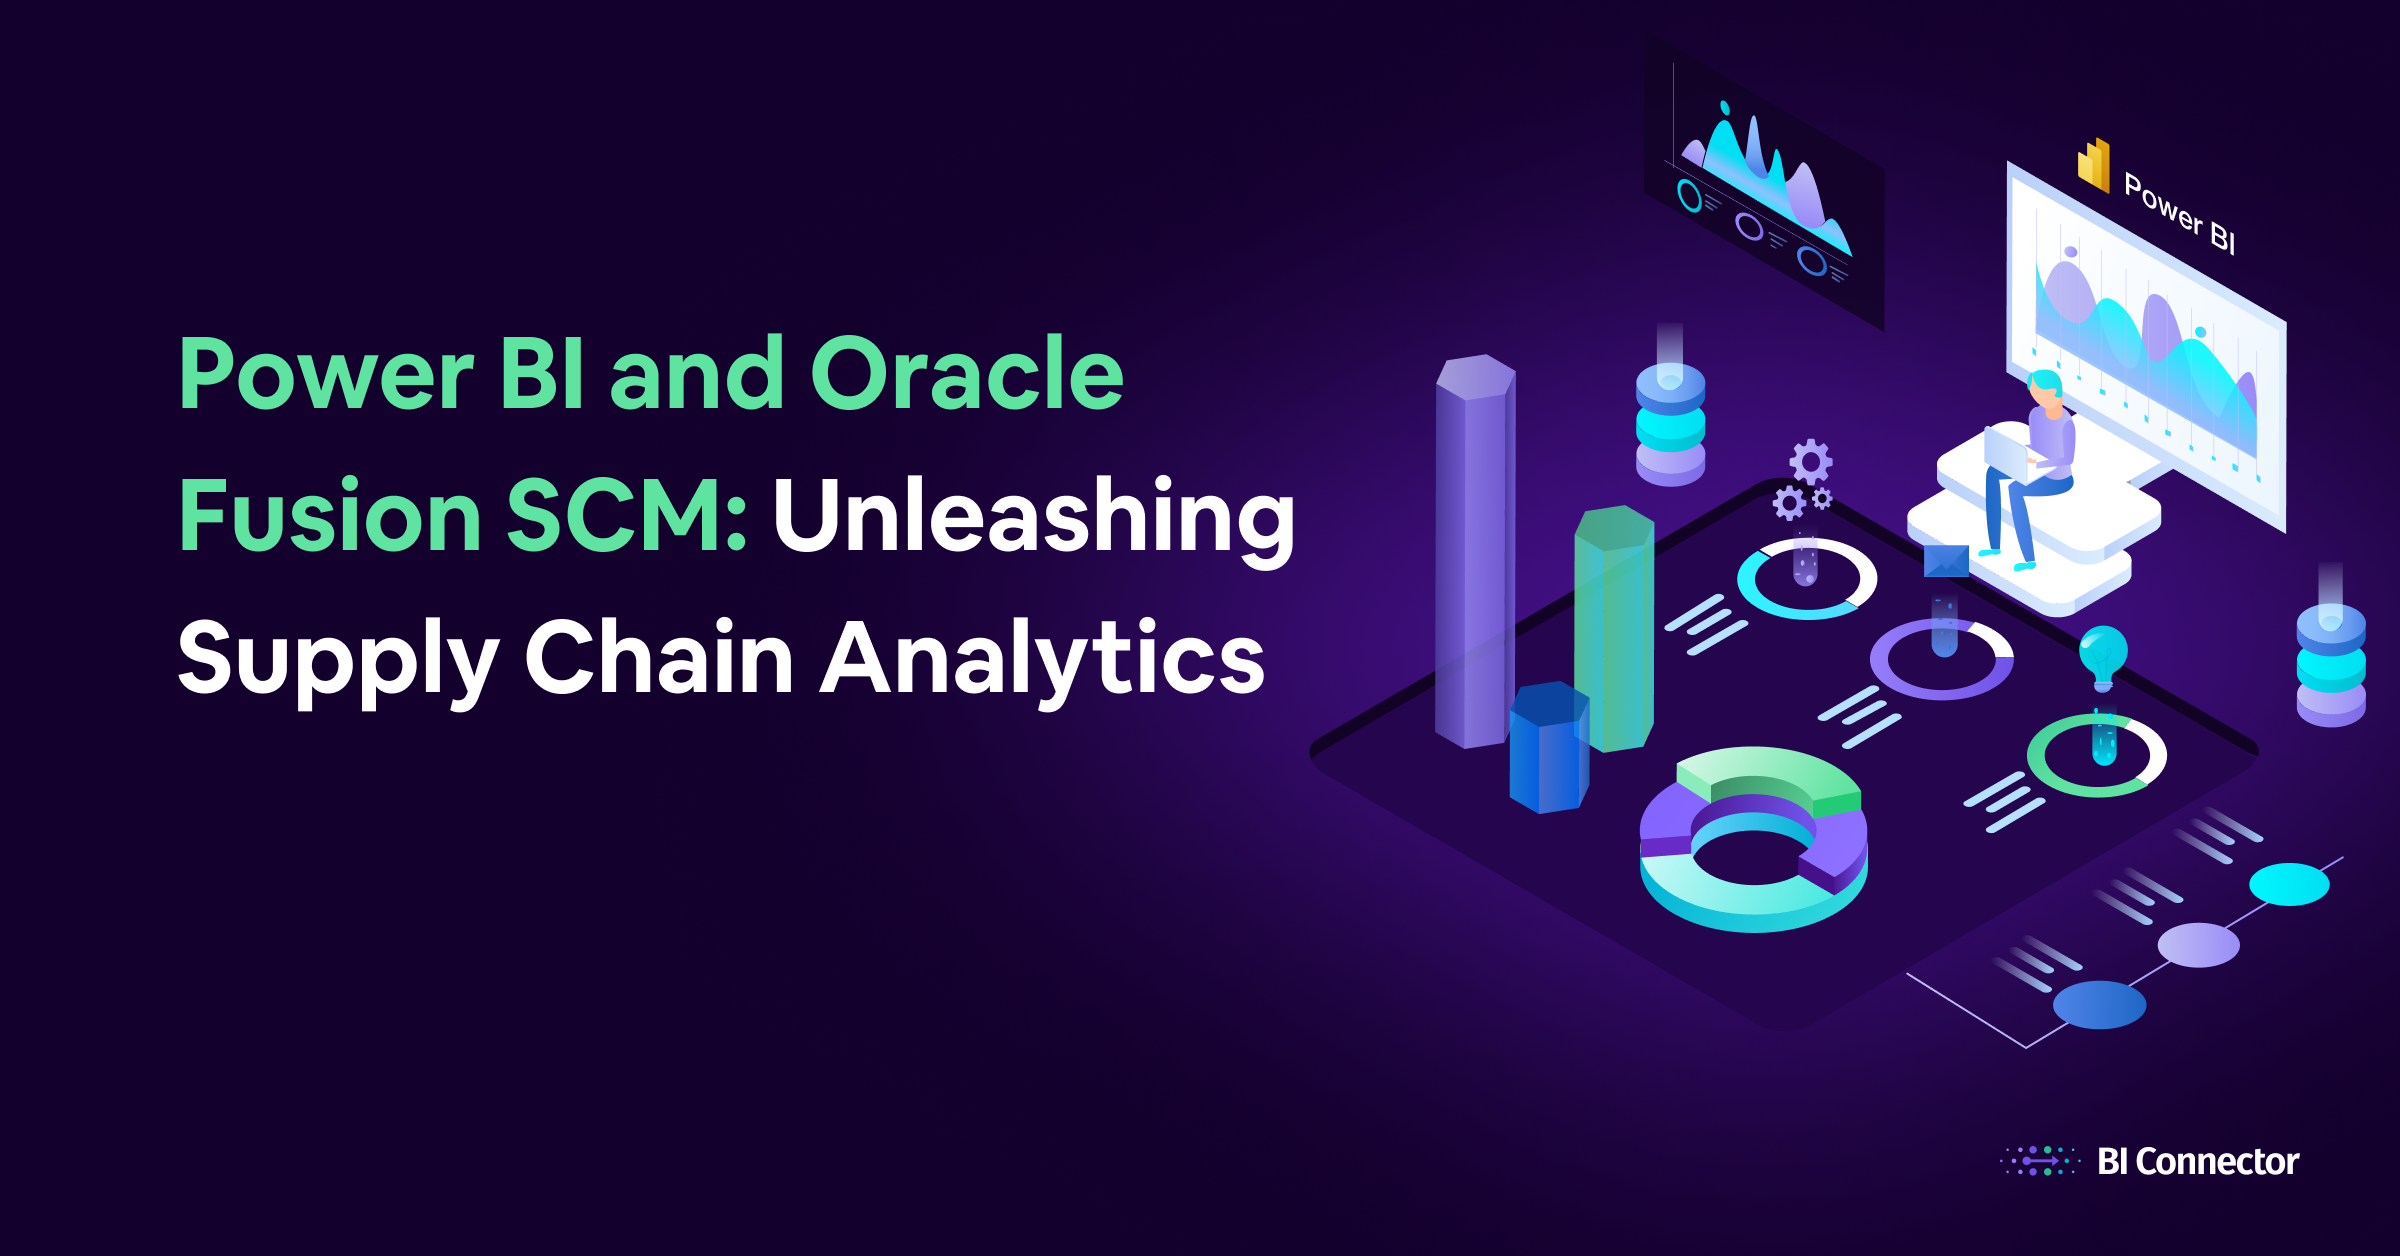

Power BI and Oracle Fusion SCM: Unleashing Supply Chain Analytics
Global commerce in today’s world is complex. With products traversing across continents and customers demanding seamless experiences, the backbone of efficiency lies in the realm of supply chain analytics. The ability to analyze vast amounts of data efficiently is not just an advantage; it’s a necessity.
Businesses can transform raw data into actionable insights to streamline operations, enhance customer satisfaction, and maximize profitability. Data-driven decision-making also empowers them to gain a competitive edge in the rapidly changing market.
To harness these capabilities, businesses need to visualize and comprehend the data efficiently. Power BI, the self-service data visualization tool from Microsoft, has been a game changer in the industry.
Through this blog, we explore more about supply chain analytics. We will also look at how Power BI helps organizations leverage the full potential of data.
Leveraging the Power of Data in Supply Chain Management

Source: freepik.com
Data lies at the heart of every supply chain strategy.
Businesses can integrate data from various sources, such as inventory levels, performance data, consumer demand patterns, and social media interactions in Enterprise Resource Planning (ERP) and Materials Requirement Planning (MRP) software.
They provide snapshots of the supply chain, but just gathering data isn’t enough. You need a holistic view of data to extract valuable insights and make informed strategic decisions. This is where Power BI steps in.
The analytics tool can complement ERP systems to consolidate disparate data and remove silos within business functions. This is all the more critical in enterprises and multi-channel supply chains where massive datasets are involved.
Its self-service features also ensure that technical and business users can build reports and dashboards to answer strategic queries and examine the data. Users can identify bottlenecks, track inventory, predict future trends, and optimize operations based on meaningful insights.
Let’s look at a multi-national electronics retailer as an example. The company integrates data from various sources, such as sales transactions, supplier performance metrics, and inventory levels, to create comprehensive dashboards in Power BI and identify customer purchasing trends.
For instance, there was a surge in smartphone sales during the holiday season. This helped the retailer adjust inventory levels and negotiate deals with suppliers for ample stock during peak demand periods.
They also monitored stock levels across warehouses and stores in real-time, reducing inventory costs, minimizing stockouts, and improving overall operational efficiency.
Enhanced Data visualization for Supply Chain Analytics
Power BI dashboard is a powerful tool that helps track stock levels, workload scheduling, logistics, and much more. The dashboard provides a comprehensive view of relevant KPIs in a single place accessible to all stakeholders anywhere, anytime.
When complemented with advanced analytics capabilities such as AI/ML models, businesses can augment supply chain management in different ways.
Here, we look at how Power BI can empower businesses across the main types of supply chain analytics:
Descriptive Analytics
Descriptive analytics uses statistical methods to summarize information and help understand what has happened. By integrating data sources from various management systems, businesses can assess historical performance.
Power BI’s ability to process both structured and unstructured data allows for a comprehensive analysis. Users can then visualize data in the form of charts, graphs, or maps to highlight past trends and challenges in a clear manner.
Diagnostic Analytics
Diagnostic analytics delves deeper into understanding why certain events occurred or not working as it should. Power BI’s real-time capabilities allow businesses to identify bottlenecks and inefficiencies in the supply chain.
For instance, a sudden rise in inventory levels or a drop in consumer demand. Diagnostic analytics can pinpoint the root causes, enabling prompt corrective actions.
Predictive Analytics
Predictive analytics can help figure out what might happen in the future. It leverages historical data and industry trends to predict future events and trends.
Machine learning algorithms in Power BI can analyze large amounts of data to forecast consumer demand with remarkable accuracy. As previously mentioned, businesses can optimize their inventory levels, reduce excess stock, and minimize shortages. This helps in building a resilient supply chain.
Prescriptive Analytics
Prescriptive analytics empowers businesses to take proactive actions using data analysis. By leveraging artificial intelligence and advanced analytics techniques, Power BI can predict future outcomes and suggest the best course of action. The embedded decision logic enables it to analyze real-time market trends and provide actionable takeaways.
For example, Power BI can recommend the optimal reorder levels for products, ensuring businesses are always one step ahead in their supply chain management.
Harnessing the full potential of Power BI in SCM Analytics
Power BI is a versatile solution with rich features to to visualize supply chain performance. Here are some features and benefits of Power BI in supply chain analytics:
Integrating Diverse Data Sources
One of Power BI’s standout features is its ability to aggregate data from a multitude of sources– whether it’s cloud databases like Azure or Google Cloud, or platforms like Oracle SCM, SAP, or even Excel or CSV files in a local computer.
Power BI seamlessly integrates data, providing a 360-degree view of the supply chain landscape.
Real-Time Analytics
In the fast-paced world of supply chain, real-time data analysis is non-negotiable. Power BI’s real-time capabilities empower businesses to monitor their supply chain activities and quickly respond to dynamics.
Users can consolidate data in a single dashboard and generate reports as needed. Power BI Gateway helps refresh data for real-time updates.
Customized reports and dashboards
Based on different business requirements–analytical, operational, or strategic–users can build customized dashboards.
Tracking Key Performance Indicators (KPIs)
Determining key success factors is a crucial part of measuring business outcomes. Power BI enables users to define and visualize KPIs in dashboards. This is useful for a supply chain that involves multiple vendors using different platforms and data sources.
User-friendly Features
Power BI is renowned for its user-friendly features, including drag-and-drop and filter functionality. Its self-service capability empowers technical and non-technical users to easily visualize data without relying on IT teams.
Oracle Fusion SCM for Supply Chain Analytics
Oracle Fusion Supply Chain Management (SCM) Analytics is a prebuilt cloud-native solution that helps data professionals analyze supply chain management and improve efficiency. It enables users to identify bottlenecks in order management, evaluate inventory movement, and manage procurement.
Oracle Fusion SCM analyzes data from the Oracle Cloud SCM application and provides a single source of truth. Many businesses complement the analytical capabilities of Oracle Fusion SCM with Power BI’s visualization, making the most out of both tools.
However, importing data is a challenge. Users might have to extract data to Excel files or write SQL queries to fetch data, which can take hours or days. It’s time time-consuming and tedious process.
With BI Connector, users can directly connect Power BI to Oracle data in minutes. It takes only a few minutes to import data and start visualizing. We enable users to bring all their Oracle data, including OBIEE, OAC, OAS, and Oracle Fusion (ERP, SCM, HCM, and CX).
Users can securely access Oracle subject areas and reports and start creating interactive dashboards in minutes. As a certified Power BI connector, it is compatible with both Desktop and Server editions and connects data in Direct and Import Query modes.
Click on the banner to learn more.
Conclusion
Power BI is a popular self-service data visualization tool known for its user-friendly and intuitive features. In the dynamic realm of supply chain data analytics, organizations can harness the tool’s powers to process vast amounts of data and make the most out of it. Users can understand what happened in the past, how the present is going, and also predict what will happen tomorrow to navigate the best course of action.
Power BI enables businesses to integrate data from multiple sources, build customized dashboards, and gain insights, enhancing supply chain performance. With Power BI in their arsenal, organizations can thrive in the face of the ever-evolving supply chain and dynamic landscape of modern business.