
March 18th, 2024
Power BI DAX Functions: Explained with Examples
In the realm of data analysis and visualization, Power BI stands out as a powerful tool that empowers users to derive valuable insights from their data. Central to the functionality of Power BI is DAX, or Data Analysis Expressions.
DAX serves as the backbone for calculations, aggregations, and data manipulation within Power BI, making it an essential skill for data analysts seeking to harness the full potential of this tool.
In this blog, we will explore all about Power BI Dax, along with examples of DAX functions. Keep reading to know more.
What is DAX on Power BI?
At its core, DAX (Data Analysis Expressions) is a formula language that enables users to create custom calculations in Power BI. These calculations can range from simple arithmetic operations to complex statistical analyses.
DAX plays a crucial role in enhancing the capabilities of Power BI by allowing users to create calculated columns, measures, and calculated tables within their data models. It operates within the framework of Power BI to perform calculations within the data model.
It provides a powerful and flexible syntax for defining calculations based on the data available in the model. DAX expressions can reference columns, tables, and relationships within the data model to generate dynamic and context-aware results.
How do I write DAX code in Power BI?
Writing DAX code in Power BI is a straightforward process that involves creating formulas to perform calculations on data.
To write DAX code, users can utilize the formula bar in Power BI Desktop or directly enter expressions within calculated columns, measures, or calculated tables. Understanding the syntax and structure of DAX is essential for effectively creating and debugging formulas in Power BI.
DAX expressions consist of functions, operators, and references to columns and tables within the data model. Users can leverage a wide range of built-in DAX functions to perform calculations such as aggregation, filtering, and time intelligence.
Additionally, DAX supports the use of variables to store intermediate results and improve the readability of complex expressions.
Is DAX a coding?
While DAX shares some similarities with traditional programming languages, such as its use of functions and operators, it is not typically classified as coding in the traditional sense.
Instead, DAX is considered a specialized language for data analysis within the context of Power BI. Its focus on manipulating and analyzing data sets it apart from general-purpose programming languages.
DAX is designed to be intuitive and user-friendly, allowing data analysts to perform complex calculations without extensive programming knowledge. However, proficiency in DAX requires an understanding of its syntax, functions, and concepts, such as filter context and row context.
What is the difference between Power BI Query and DAX?
Power BI utilizes two primary languages for data manipulation: Power Query (M) and DAX.
Power Query is responsible for data transformation and shaping, while DAX is used for calculations and analysis. While both languages are integral to the data modeling process in Power BI, they serve distinct purposes and are often used in conjunction to create comprehensive data models.
Power Query enables users to connect to various data sources, clean and transform data, and load it into the Power BI data model. It utilizes a graphical interface for data transformation tasks, making it accessible to users with diverse backgrounds in data analysis.
DAX, on the other hand, operates within the data model to perform calculations and analysis on the transformed data. It allows users to define calculated columns, measures, and calculated tables to derive insights from the data. DAX expressions can reference columns and tables created during the data transformation process, enabling seamless integration between data shaping and analysis.
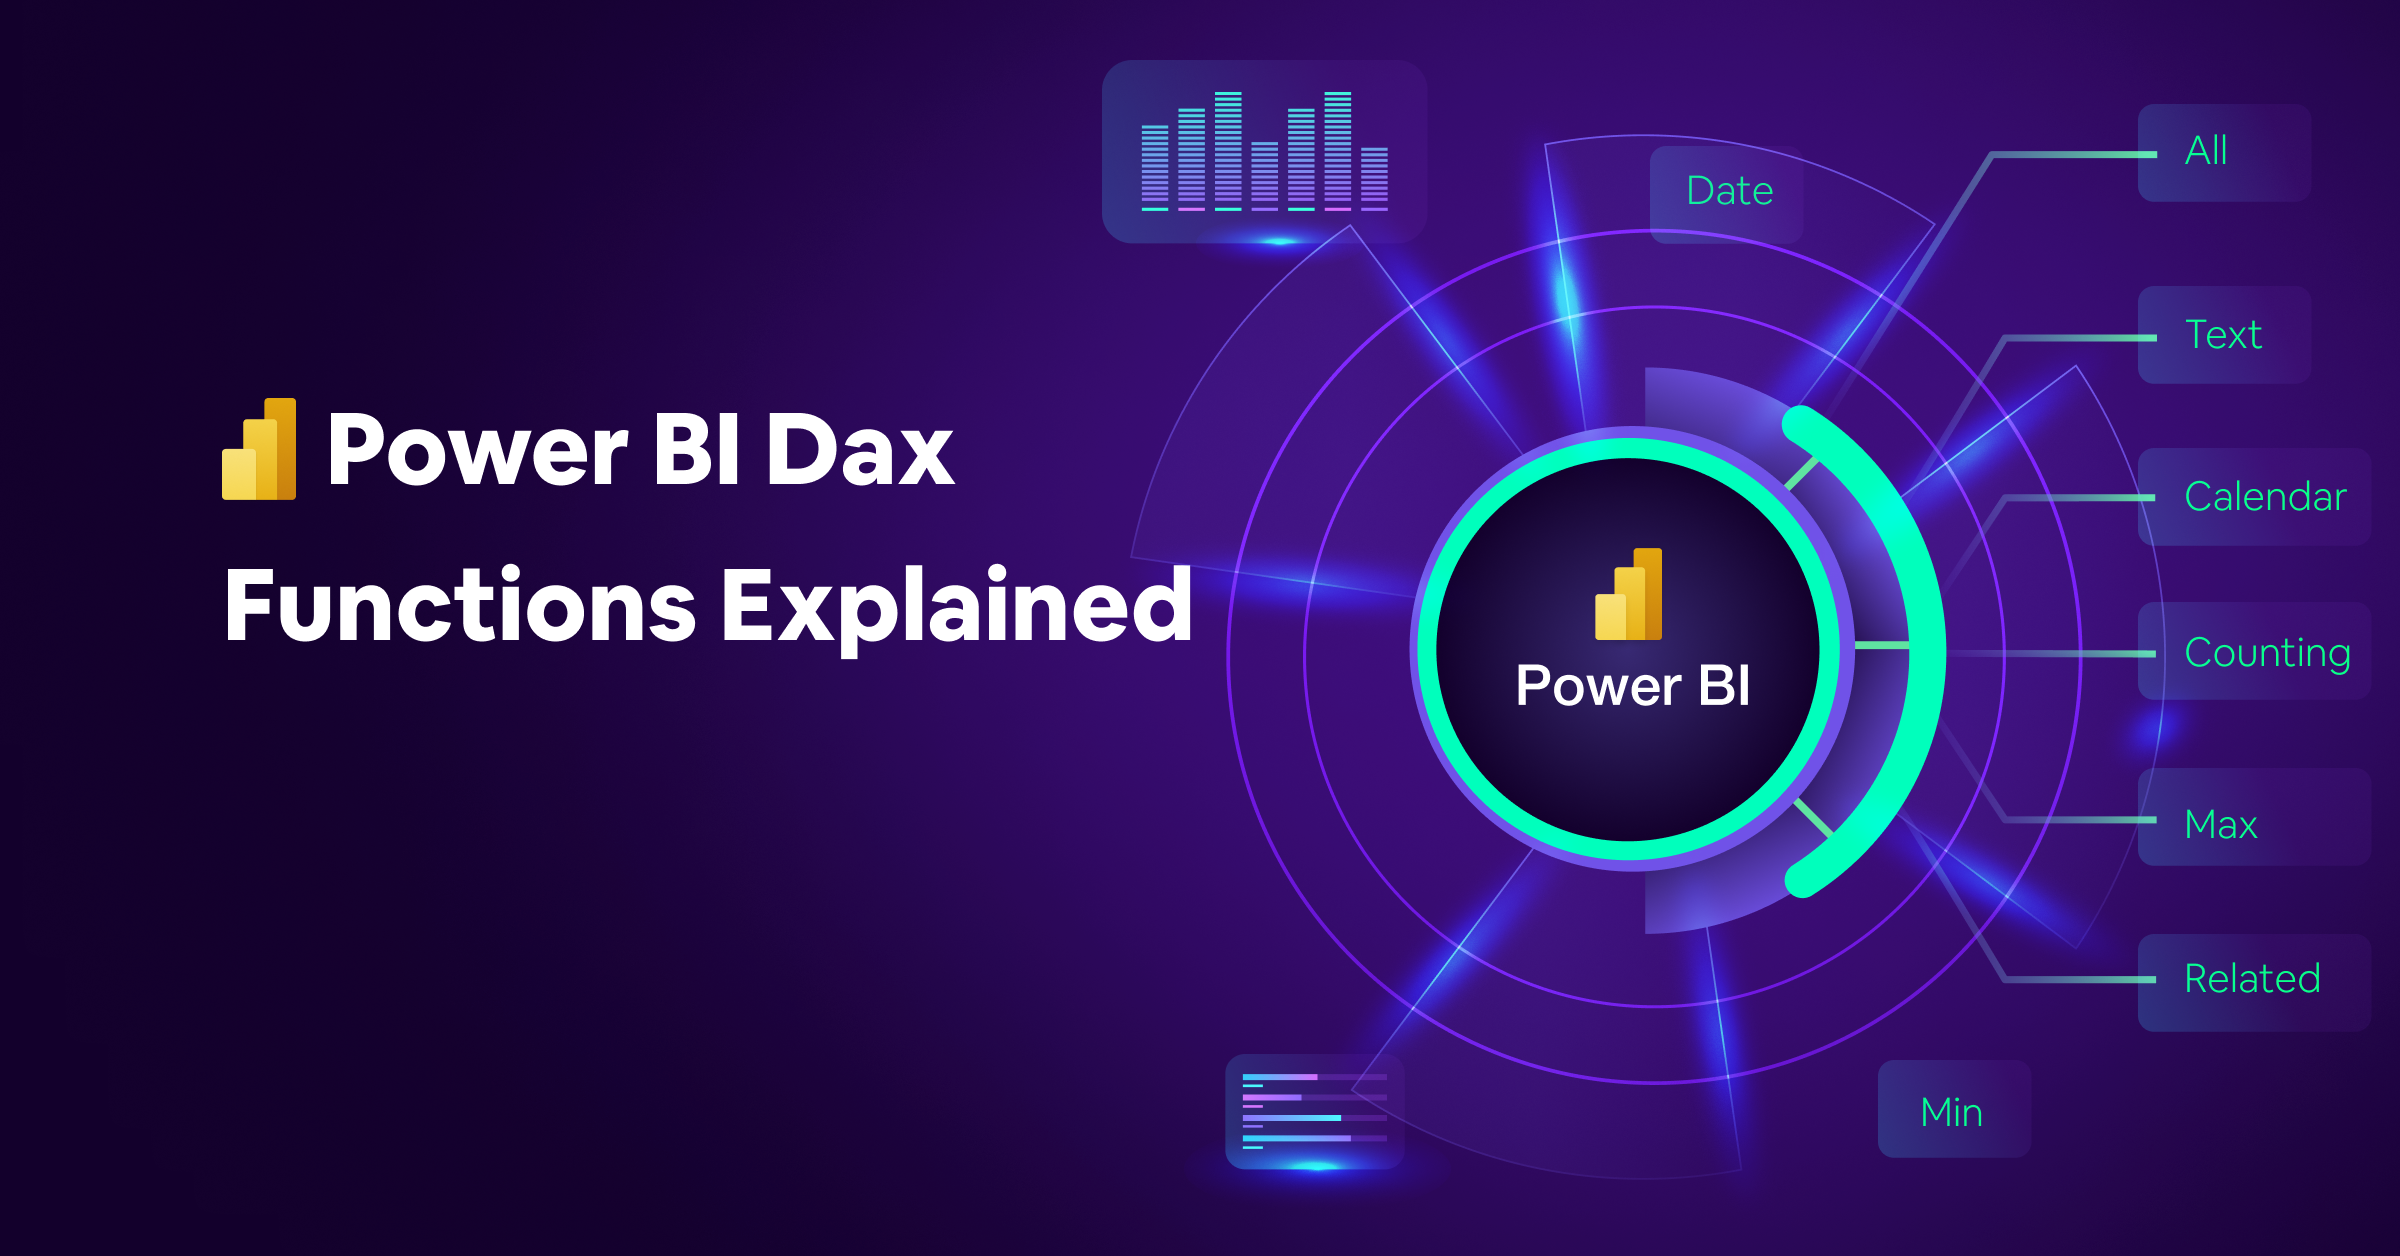
Examples of DAX Functions and Formulas
DAX offers a wide range of functions and formulas for performing various tasks, including data aggregation, filtering, and time intelligence.
Some commonly used DAX functions include
- SUM,
- AVERAGE,
- CALCULATE, and
- RELATED
Additionally, DAX provides powerful time intelligence functions for analyzing trends and patterns over time, such as
- DATEADD,
- TOTALYTD, and
- SAMEPERIODLASTYEAR
To demonstrate the practical application of DAX functions, let’s consider a scenario where we need to analyze sales data to calculate year-to-date (YTD) sales figures.
We can use the TOTALYTD function in DAX to calculate the cumulative sales from the beginning of the year up to the current date, considering any filters applied to the data.
DAX
Copy code
Total Sales YTD = TOTALYTD(SUM(Sales[Amount]), ‘Date'[Date])
In this example, ‘Sales[Amount]’ refers to the sales amount column in the Sales table, and ‘Date'[Date] refers to the date column in the Date table.
The TOTALYTD function calculates the total sales year-to-date based on the specified date column.
Understanding Data Models and Analysis Services
In Power BI, data models organize and analyze data by establishing table relationships. Analysis Services, a core component, offers advanced data modeling features for scalable solutions.
Data modeling involves defining relationships, creating calculated columns and measures, and optimizing performance. These relationships enable cross-table analysis, extracting deeper insights.
Analysis Services enhances Power BI with features like data compression and query optimization, improving performance. Centralized deployment enables collaborative access, facilitating efficient sharing of insights.
Practical Examples of DAX Usage in Power BI
To truly grasp the power and versatility of DAX, let’s delve deeper into two practical examples that data analysts commonly encounter in their work:
Calculating Year-to-Date (YTD) Sales Figures:
As a data analyst, understanding the sales performance over time is crucial. By utilizing DAX’s TOTALYTD function, you can calculate the cumulative sales from the beginning of the year up to the current date, even when applying filters to the data. This enables you to track sales trends and make informed decisions regarding marketing strategies or inventory management.
Creating a Rolling Average of Monthly Sales:
Analyzing sales trends on a monthly basis is essential for identifying seasonality patterns and forecasting future sales.
With DAX, you can create a rolling average of monthly sales using functions like AVERAGEX and FILTER. This allows you to smooth out fluctuations in sales data and gain insights into long-term trends, helping you make more accurate predictions and plan accordingly.
By applying these practical examples in your analysis workflow, you can harness the full potential of DAX to derive actionable insights and drive business success.
As you become more proficient in DAX, you’ll discover countless opportunities to streamline processes, uncover hidden trends, and make data-driven decisions that propel your organization forward.
Conclusion
DAX functions play a vital role in enhancing the capabilities of Power BI for data analysis and visualization. By mastering DAX, data analysts can unlock the full potential of Power BI and gain valuable insights from their data.
As organizations continue to rely on data-driven decision-making, proficiency in DAX becomes increasingly valuable for data professionals seeking to advance their careers in the field of analytics.
We encourage data analysts to explore and experiment with DAX functions in Power BI to further their understanding and proficiency in this essential tool.
With continued practice and learning, data analysts can leverage the power of DAX to drive meaningful insights and value for their organizations.
If you’re an Oracle user, BI Connector is a must-have solution for data visualization. It helps you connect Oracle data to Power BI in just minutes! You can bring all your data from Oracle Fusion (ERP, SCM, HCM, and CX), OBIEE, OAC, OAS, and OTBI to Power BI with a few easy clicks.
As a Power BI-certified solution, BI Connector enables users to connect both Power BI Desktop and Service straight to your Oracle Fusion Data Models. It comes with a number of robust features, including shorter wait times and ease of use.
Click below to know more.